Most finance teams do not find out a forecast was wrong until the cash is already gone. Financial forecasting software closes that gap, turning historical data into a rolling, current view of cash flow instead of a guess frozen in time.
For this ranking, we focused on what actually matters when finance teams evaluate financial forecasting tools, budget forecasting software, and cash flow forecasting software:
- Accuracy of financial forecasts: How well the software turns historical data and current and historical data into projections that finance leaders can defend to the board, not just a best guess dressed up in a chart.
- Integration with existing financial data: Whether the platform connects cleanly to accounting software, project data, and the other systems finance teams already rely on for financial reporting.
- Scenario modeling and flexibility: The ability to run multiple forecasting methods, build rolling forecasts, and test assumptions as market volatility, seasonal trends, and economic indicators shift.
- Visibility for finance and operational leaders: Customizable dashboards and reporting that give business leaders and key stakeholders a shared, real time view of financial performance and future performance.
- Cost and scalability: A reasonable price that fits growing firms today and still supports more complex budgeting processes and multiple business units as the company scales.
What Is Financial Forecasting Software?
Financial forecasting software turns historical data and current transactions into a forward-looking view of the business, helping finance teams predict future outcomes instead of guessing. It connects to accounting software and other financial data sources, applies established forecasting methods, and keeps the financial forecasting process rolling and current, producing a complete financial forecast instead of a once-a-year budgeting ritual that goes stale by the second quarter.
For professional services firms, that usually means tying the forecast to project economics: what is quoted, what is staffed, what is billed, and what actually lands in the bank. When a forecast is disconnected from that operational data, finance teams end up reconciling two versions of the truth every month, and the forecast is the one that loses credibility.
The Benefits of Financial Forecasting Software
A dependable forecasting process changes more than the accuracy of next quarter’s numbers. It connects project budgeting, sales forecasting, and delivery data in one place, and it changes how confidently finance leaders and business leaders can make decisions about hiring, spending, and growth, because the forecast is grounded in real financial data instead of a guess dressed up in a chart. Here is what typically changes once financial forecasting software replaces a patchwork of spreadsheets:
- More accurate forecasts finance teams can actually defend. When forecasts pull from current and historical data automatically instead of manual entry, the room for copy-paste errors and version-control confusion shrinks.
- Faster, more confident financial planning. Rolling forecasts replace the once-a-year budgeting marathon with a process that updates as new operational data comes in, so annual project planning and mid-year course corrections both start from current trends rather than past performance alone.
- Clear visibility into cash flow before it becomes a problem. Cash flow projections built from real invoices, bills, and project billing schedules give finance leaders a genuine early-warning system, rather than a lagging view that only confirms a shortfall after it happens.
- Better resource allocation across projects and business units. When a financial forecast reflects what is actually staffed and billed, business leaders can allocate resources, plan hiring, and prioritize investments based on where the numbers say growth is headed, not where it felt like growth was headed.
- Actionable insights instead of static financial reporting. Customizable executive dashboards translate the forecasting process into something finance leaders and key stakeholders can actually use in a meeting, rather than a static report that gets skimmed once and filed away.
- More confident, informed decision making across the firm. With clean financial models and current data behind every number, finance leaders support informed decision making instead of guesswork, and the plans behind hiring, spending, and future growth hold up under scrutiny.
What Features Should the Best Financial Forecasting Software Have?
Not every tool that calls itself a financial forecasting platform can support how finance teams actually work, where a forecast has to reconcile against a balance sheet, a project plan, and a board deck all at once. Here are the features that separate a genuinely useful financial forecasting tool from a glorified spreadsheet template in 2026.
Rolling forecasts built on real time and historical data
A financial forecast is only as good as the data feeding it. Strong platforms combine historical sales data and historical financial data with real time data from accounting software and operational systems, then refresh rolling forecasts automatically instead of requiring someone to rebuild the model every month. This keeps the forecasting process built on up to date data rather than a stale export from six weeks ago.
Scenario modeling and what-if analysis
Finance leaders rarely need one number, they need a range: best case, expected case, and what happens if a large client delays payment. The best financial forecasting tools let teams establish baseline forecasts, then apply quantitative models and multiple forecasting methods to estimate future outcomes under seasonal trends, market volatility, or a staffing change without rebuilding the entire model from scratch.
Cash flow forecasting and cash flow statement visibility
Profit on paper and cash in the bank are two different problems, and a good platform treats them that way. Look for cash flow projections that tie directly to the cash flow statement and the pro forma income statement, factor in payment timing and DSO, and flag a cash shortfall early enough for finance teams to act on it instead of react to it.
Integration with accounting software and existing financial data
A financial forecasting tool that lives apart from the accounting software of record just creates a second, competing version of the truth. The strongest platforms make it easy to gather historical data from QuickBooks, Sage, NetSuite, or similar systems, so finance teams and the accounting firms that support them are not reconciling two sets of numbers by hand.
Customizable dashboards for every stakeholder
A controller, a finance director, and a project lead all need a different view of the same forecast. Customizable dashboards let each group see the key metrics that matter to their role, whether that is utilization rate and margin for an operations leader or DSO and covenant compliance for a CFO, without needing a dedicated team of financial analysts to build a separate report from scratch.
Budget forecasting and variance analysis
Forecasting and budgeting should live in the same system, not two disconnected tools that never quite agree. Solid budget forecasting features let finance teams compare actuals to budget by department, project, or business unit, support demand planning and financial consolidation across multiple business units, and surface variance analysis automatically so drift gets caught while there is still time to correct it.
Collaboration, audit trail, and data governance
Forecasts get built by more than one person, and finance teams need to know who changed what and when. Strong platforms include role-based permissions, version history, and an audit trail, which matters as much for internal trust in the numbers as it does for external audit and compliance requirements.
How to Choose Financial Forecasting Software
Finding the right forecasting software depends less on the longest feature list and more on how closely the platform mirrors the way your firm actually makes money. Use these decision points to narrow the field:
- Does it fit how your firm actually operates? Whether you run an engineering practice, a consulting firm, or one of the many accounting firms supporting client forecasts, the software should model your business, not a generic one.
- Does it connect to the data you already trust? If the software cannot pull cleanly from your accounting software and project systems, you are just building a fourth spreadsheet with better colors.
- Does it reflect where the firm is headed, not just where it has been? A forecast built only on past performance and static operational plans will always lag reality; look for a platform that adjusts as assumptions shift.
- Will finance and operations actually use it? A tool that requires a dedicated FP&A analyst to operate rarely gets used consistently by a lean mid-market finance team.
- How fast can you get live? A 30-to-90-day rollout gets a forecasting process into finance teams’ hands in one quarter; a 6-to-12-month implementation delays the value by a year.
- Does the pricing scale the way your firm will? Look past the entry price and ask what the platform costs once you add more users, more entities, or more complex budgeting processes.
- Is there a real support model behind it? Forecasting touches every department, so responsive support and clear onboarding resources matter more here than in a single-purpose tool.
2026 Financial Forecasting Software Ranking
This 2026 ranking focuses on platforms that do more than generate a chart. The tools below are assessed on how well they turn historical data and real time data into a forecasting process finance teams can run every week, not just at budget season: cash flow forecasting accuracy, integration with existing financial data, scenario modeling depth, responsiveness to shifting market trends, and how well the platform holds up as a firm adds more projects, more entities, and more complexity.
Financial Forecasting Software Comparison
Before the in-depth reviews, here is a quick side-by-side look at how the leading financial forecasting tools compare on the features, ideal buyer, pricing, and reputation that tend to matter most in a 2026 evaluation.
| Tool | Key Features | Best For | Pricing | G2 / Capterra Rating |
| BigTime | GL-native budgeting, resourcing, and cash flow forecasting connected to delivery and billing data. | Professional services firms (IT, engineering, consulting) that need forecasts tied to real project and billing data. | Starts at $20/user/month (Essentials); higher tiers add forecasting depth. | G2: 4.5, Capterra: 4.6 |
| Fathom | Visual reporting with strong scenario and what-if modeling on top of accounting software. | Smaller finance teams that want clean, visual forecasts without building models from scratch. | From about $29 to $59 per month. | G2: 4.5, Capterra: 4.6 |
| Float | Visual cash flow timeline synced directly to Xero, QuickBooks Online, or FreeAgent. | Small businesses and lean teams that only need cash flow visibility, not full financial forecasting. | Starts at $59/month (Essential); Premium $99; Enterprise $199. | G2: 4.5, Capterra: 4.5 |
| Jirav | Budgeting, forecasting, and cash flow tracking with strong data import and support scores. | VC-backed startups and smaller finance teams that want quick budget-to-actuals visibility. | Custom, quote-based. | G2: 4.7, Capterra: 4.6 |
| Vena | Excel-native planning, budgeting, and forecasting with governance and an audit trail. | Finance teams that want to keep working in Excel while adding enterprise-grade controls. | Custom, quote-based enterprise contracts. | G2: 4.6, Capterra: 4.6 |
| Prophix | Cloud or on-premises CPM suite covering budgeting, forecasting, and reporting via a cube-based model. | Mid-sized and larger finance teams that want a full corporate performance management suite. | Custom, quote-based. | G2: 4.4, Capterra: 4.3 |
| Datarails | Consolidation and FP&A workflows layered directly on top of existing Excel models. | Excel-first SMB finance teams that want more governance without abandoning their models. | Typically starts around $24,000 per year. | G2: 4.6, Capterra: 4.7 |
| Cube | Spreadsheet-native FP&A that works inside Excel or Google Sheets with automated data pulls. | Mid-market finance teams that want automation without leaving their spreadsheet workflow. | Custom, quote-based. | G2: 4.5, Capterra: 4.6 |
| Planful | Dynamic budgeting, forecasting, and multi-entity consolidation for larger organizations. | Mid-market and enterprise companies with multiple entities that need consolidated reporting. | Starts at approximately $1,250/month; custom enterprise pricing. | G2: 4.3, Capterra: 4.3 |
BigTime
Reviews: G2: 4.5/5, Capterra: 4.6/5.
Pros & Cons
Pros:
- Financial forecasting built on the same GL-native foundation as delivery and billing. Because BigTime is a PSA platform built on top of QuickBooks and Sage, forecasts start from real project, time, and billing data instead of a spreadsheet layer that lives apart from the general ledger.
- Rolling forecasts that stay connected to budgets and actuals. Budgeting and portfolio visibility inside BigTime track burn, project margin, and cash flow implications while work is still in progress, not after the month closes and it is too late to course-correct.
- Resourcing and quoting inherit the same financial logic as delivery. Utilization forecasts, staffing plans, and quotes are grounded in the same cost and billing rules used across the platform, so forecasts do not quietly drift from operational reality as the firm grows.
- Fast time to value without a lengthy FP&A implementation. Most firms are live in 30 to 90 days, a fraction of the 6-to-12-month rollouts common with enterprise planning suites, which means finance teams get a working forecasting process in one quarter, not one year.
Cons:
- Teams that only need a lightweight, standalone cash flow forecasting tool with no project or billing context may find BigTime broader than that narrow use case requires. BigTime’s forecasting depth shows up most for firms that also care about utilization, rate management, and margin control, not just a cash balance projection.
BigTime approaches financial forecasting as an extension of the same data finance teams already trust for billing and delivery, not a second system finance has to feed by hand every month.
Because the platform is built as a financial system of record on top of QuickBooks and Sage, a cash flow forecast, a budget forecast, and a utilization forecast all pull from one financial logic instead of three disconnected spreadsheets that never quite agree with each other. When a project runs long or a rate changes, the forecast updates with it, so leadership gets a rolling, real time view of margin, cash flow, and capacity without forcing delivery teams into a rigid, ERP-style planning process.
BigTime also applies AI driven predictive analytics to the forecasting process itself, surfacing patterns in historical data and flagging where a forecast is likely to drift from actual financial performance before it shows up in a month-end report. Combined with Data Hub connectivity into tools like Power BI, finance leaders keep full access to the underlying financial data behind every forecast, rather than being boxed into a black-box report they cannot trace back to a source.
Key Features
- Budgeting and burn tracking: Budgets update against actuals as work happens, with alerts when cost overruns accelerate, so finance teams catch drift while a project is still in motion.
- Resource and capacity forecasting: Utilization and staffing forecasts reflect real availability, skills, and cost data, connecting resourcing decisions to the same financial logic as delivery and billing.
- Rate and cost management: Configurable rate cards and cost controls support nuanced pricing and margin forecasting across projects, clients, and teams.
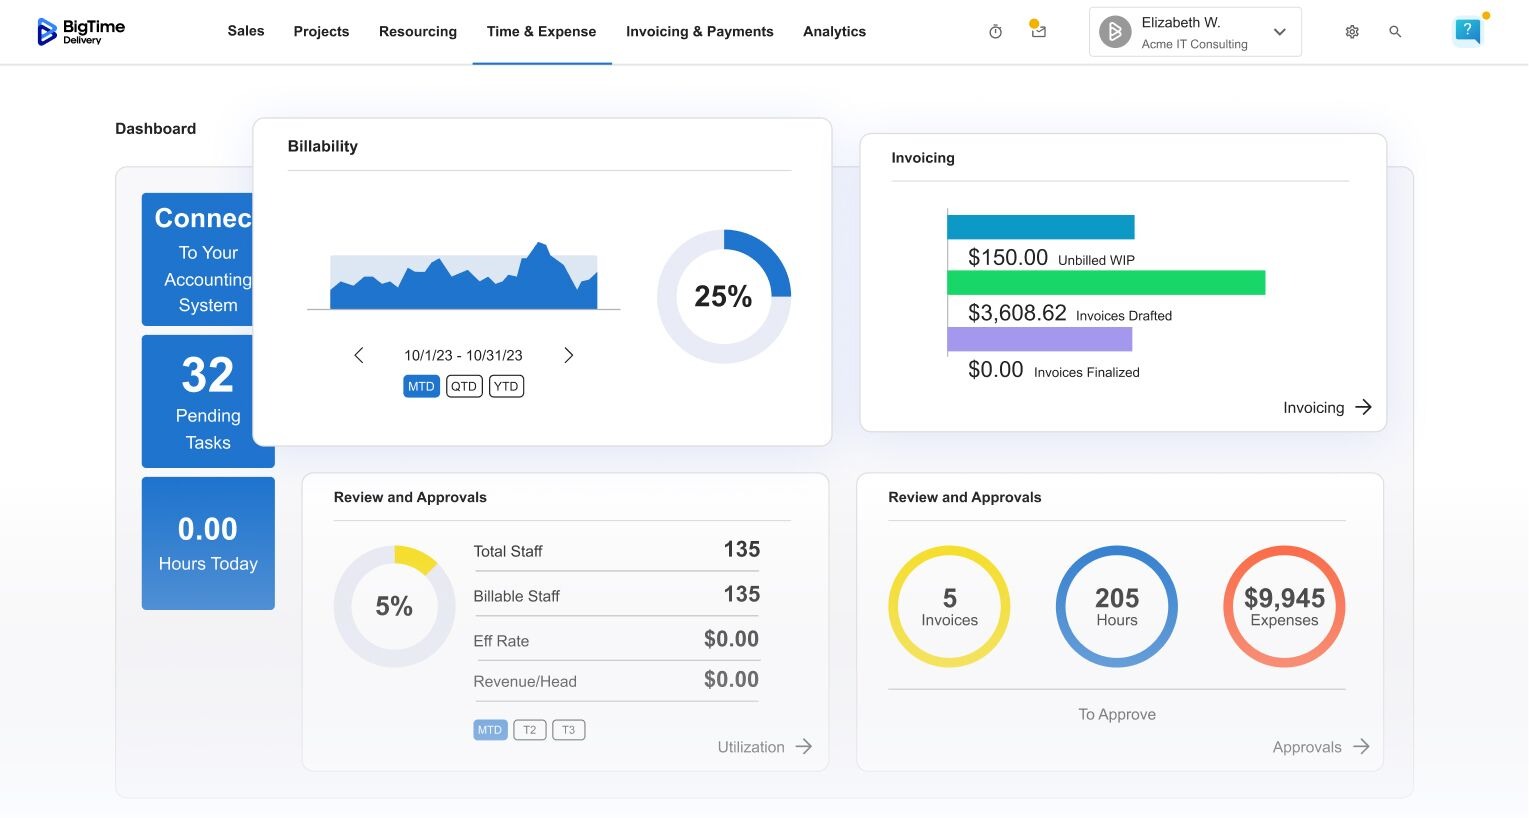
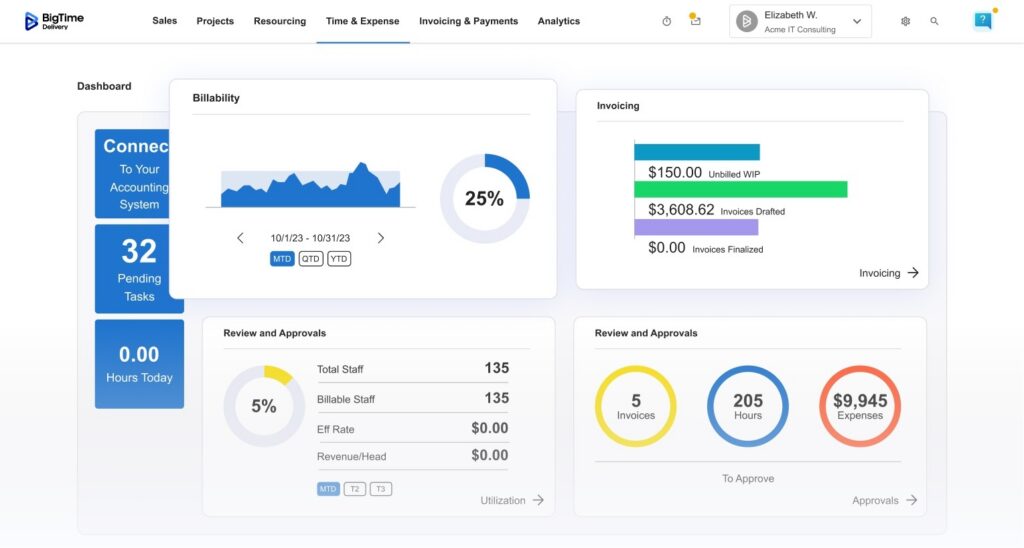
- Real-time project financial reporting: Dashboards surface margin, budget burn, and profitability data as data comes in, giving finance and operational leaders a shared, current view of financial performance.
- QuickBooks and Sage-native financial continuity: Bi-directional GL integration keeps forecasts, invoices, and reconciliations in sync without manual double entry.
- Data Hub and BI connectivity: Direct access to raw financial and operational data through tools like Power BI supports deeper, customizable financial reporting beyond BigTime’s native dashboards.
- AI-driven insights: BigTime’s AI layer flags anomalies and margin risk in the underlying data, helping finance teams spot forecasting drift before it turns into a surprise.
Pricing
BigTime Essentials starts at $20 per user/month; Advanced, Premier, and Enterprise are positioned as higher tiers with deeper budgeting, resourcing, and reporting capability (Enterprise is a custom, “speak with an expert” option). A free personalized demo is available.

Fathom
Reviews: G2: 4.5/5, Capterra: 4.6/5.
Pros & Cons
Pros:
- Strong scenario and what-if modeling for a quick directional answer. Fathom makes it easy to toggle assumptions and see the impact on future performance without building a new model from scratch.
- Clean, visual reporting that non-finance stakeholders can actually read. Charts and consolidated views translate financial forecasts into something a board or department head can absorb quickly.
- Straightforward setup for firms already on Xero, QuickBooks, or MYOB. The connection to existing accounting software cuts down on manual data collection for a basic forecast.
Cons:
- Built primarily as a reporting and light forecasting layer on top of accounting software, not a system of record. Fathom lacks the project-level cost, billing, and resourcing data that professional services firms need for margin-accurate forecasts.
- Multi-entity consolidation and complex rate structures require workarounds. Firms with varied billing models across clients or business units often find the modeling shallow once complexity increases.
- Not designed to connect forecasts to delivery, staffing, or billing workflows. A finance team gets a forecast, but the operational data behind it still lives somewhere else.
Fathom is best understood as a reporting and forecasting layer that sits on top of an existing accounting system rather than a standalone financial forecasting platform. It pulls financial statements from connected accounting software and turns them into consolidated, easy-to-read reports and light scenario models, which works well for firms whose main pain point is presentation, not depth.
Where Fathom tends to fall short for professional services firms is the connection between the forecast and the work that actually drives the numbers. Because it is not built around project delivery, resourcing, or rate logic, a Fathom forecast reflects what the GL says happened, not what is currently staffed, quoted, or in progress. Firms with straightforward accounting and a need for polished board reporting tend to get the most value; firms with complex, multi-project billing usually outgrow it.
Key Features
- Consolidated financial reporting: Pulls data from connected accounting software into polished, presentation-ready reports for boards and stakeholders.
- Scenario and what-if modeling: Lets finance teams test assumptions like a revenue drop or a cost increase and see the projected impact quickly.
- KPI and dashboard tracking: Tracks custom financial and operational metrics alongside the core forecast.
- Multi-entity consolidation: Supports rolling up multiple entities into one view, though configuration effort increases with complexity.
Pricing
Plans typically start around $29/month for a Basics tier, with a Plus tier around $59/month; pricing scales with the number of entities and users.
Float
Reviews: G2: 4.5/5, Capterra: 4.5/5.
Pros & Cons
Pros:
- Easy, visual cash flow forecasting for small teams. Float is built to make cash flow forecasting approachable, with a clear runway-style view instead of a spreadsheet.
- Simple scenario and budget overlays. Toggling assumptions and comparing scenarios is fast, which is useful for a quick, directional answer about cash timing.
- Direct sync with Xero, QuickBooks Online, or FreeAgent. The connection to accounting software keeps projections closer to actuals than a standalone spreadsheet.
Cons:
- Limited to a narrow accounting stack. Float only works with Xero, QuickBooks Online, and FreeAgent, which rules it out for firms on other systems.
- Not truly real time for fast-changing cash positions. Float’s own documentation notes a sync cadence rather than instant updates, which can be a gap when cash timing changes quickly.
- Shallow depth for complex, multi-project forecasting. Float is a cash flow view, not a full financial forecasting platform, so it has no resourcing, rate, or margin logic built in.
Float is a dedicated cash flow forecasting tool, not a broader financial forecasting platform, and it is upfront about that scope. It reads bills, invoices, and bank data directly from a connected accounting system and turns that into a visual timeline of future cash position, which is genuinely useful for a small business or lean finance team that mainly wants to avoid a cash surprise.
The tradeoff is depth. Float can tell a firm what its cash position looks like next month, but it cannot connect that number to project margin, resourcing, or complex billing rules, because that data simply is not part of what it models. For a professional services firm evaluating financial forecasting tools with an eye toward growth, Float tends to work best as a starting point that gets outgrown once billing and staffing complexity increases.
Key Features
- Visual cash flow timeline: Presents daily, weekly, and monthly cash flow forecasts pulled directly from connected accounting software.
- Scenario planning: Supports quick what-if adjustments to see the directional impact on future cash flow.
- Budget vs. actual tracking: Compares forecasted figures against actuals as transactions clear.
- Accounting software sync: Reads invoices, bills, and balances from Xero, QuickBooks Online, or FreeAgent automatically.
Pricing
Plans start at $59/month for the Essential tier, with Premium at $99/month and Enterprise at $199/month; a 14-day free trial is available.
Jirav
Reviews: G2: 4.7/5, Capterra: 4.6/5.
Pros & Cons
Pros:
- Strong budgeting and data import capabilities. Reviewers consistently point to Jirav’s budget creation and data handling as a standout, especially for smaller finance teams.
- Well-regarded cash flow tracking. Jirav scores highly among peer tools for making cash flow visibility approachable without heavy configuration.
- Responsive support. Jirav carries some of the highest support satisfaction scores among comparable FP&A tools.
Cons:
- Geared toward smaller, often VC-backed finance teams. Jirav’s depth is strongest for startups and small-business finance teams, which can leave more complex, multi-project firms wanting more.
- Pricing is not transparent. Jirav is a contact-us, quote-based product, which makes early-stage comparison harder for a firm trying to budget for a new tool.
- Less built-in depth for services-specific billing and rate structures. Firms with complex project billing typically need more configuration to model their business accurately.
Jirav is a cloud FP&A platform aimed at giving smaller finance teams budgeting, forecasting, and dashboarding without a heavy implementation. It has built a strong reputation for ease of use and support, and its data import and budget-creation tools tend to score well against comparable products in its size class.
Where Jirav becomes a harder fit is scale and industry specificity. It is not purpose-built around professional services billing, project margin, or resourcing, so a growing consulting or engineering firm will likely need to layer in more structure as headcount and project complexity increase. It is a solid choice for a startup or small finance team; it is a less natural fit once a firm needs forecasts tied directly to delivery and billing.
Key Features
- Budgeting and data import: Streamlined tools for building budgets and pulling in data from connected sources.
- Cash flow tracking: Dedicated views for monitoring and forecasting cash position.
- Dashboards and reporting: Customizable dashboards built for smaller finance teams that want quick visibility without a dedicated analyst.
- Scenario planning: Supports comparing budget, forecast, and actuals across scenarios.
Pricing
Jirav does not publish pricing; plans are quote-based and scaled to company size and complexity.
Vena
Reviews: G2: 4.6/5, Capterra: 4.6/5.
Pros & Cons
Pros:
- Excel-native planning that finance teams do not have to abandon. Vena rebuilds planning and forecasting inside a structure that still feels like the spreadsheets teams already know.
- Strong governance and audit trail. A central database with connected templates and a clear audit trail helps larger finance teams track exactly who changed what, and when.
- Good fit for teams scaling past ad hoc spreadsheets. Vena is a common next step for finance teams that want more control without a full platform overhaul.
Cons:
- Implementation and configuration can be substantial. Vena’s flexibility comes with setup effort that is heavier than a lightweight, single-purpose forecasting tool.
- Not built around services delivery data. Vena is a general-purpose FP&A and budgeting platform, not one designed around project billing, resourcing, or margin logic specific to professional services.
- Pricing is not public. Enterprise-style, quote-based contracts make it harder to compare costs early in an evaluation.
Vena is positioned for finance teams that want to keep working inside an Excel-like structure while gaining the governance, automation, and audit trail that spreadsheets alone cannot provide. Because everything lives in a central, connected database rather than a collection of standalone files, a rolled-up forecast is available on demand instead of requiring someone to stitch multiple tabs together by hand.
The tradeoff is that Vena is a broad FP&A and budgeting platform, not a tool purpose-built for the way professional services firms actually make money. Firms whose forecasting needs are mostly about consolidating budgets across departments tend to do well with Vena; firms that need the forecast tied directly to project delivery, utilization, and billing usually need additional structure layered on top.
Key Features
- Excel-native templates: Planning and forecasting templates that stay connected to a central database while preserving a familiar spreadsheet interface.
- Audit trail and governance: Tracks who changed which numbers and when, which supports both internal trust and external audit needs.
- Workflow automation: Automates repetitive steps in the budgeting and forecasting cycle once configured.
- Multi-user collaboration: Supports many contributors working in connected templates without breaking the underlying model.
Pricing
Vena is sold via custom, quote-based enterprise contracts; pricing depends on user count, modules, and implementation scope.
Prophix
Reviews: G2: 4.4/5, Capterra: 4.3/5.
Pros & Cons
Pros:
- Comprehensive corporate performance management suite. Prophix covers budgeting, forecasting, and reporting in one system with a long track record in the category.
- Scenario and what-if modeling. Built-in tools support testing different assumptions for more data-driven planning conversations.
- Flexible deployment. Available in both cloud-based and on-premises versions, which can matter for firms with specific IT requirements.
Cons:
- Reviewers note limited depth for forward-looking, predictive budgeting. Some users specifically call out wanting stronger predictive forecasting rather than a rearview-focused budgeting tool.
- Cube-based modeling requires dedicated setup and administration. Building and maintaining planning models is not a lightweight, self-serve process for most teams.
- Not built around services delivery data. Like most general CPM platforms, Prophix has no native connection to project billing, staffing, or margin data.
Prophix is a long-established corporate performance management platform covering budgeting, planning, forecasting, and reporting, with both automated workflows and collaboration tools built around a cube-based modeling structure. That structure gives finance teams flexibility to model nearly anything, from general planning to personnel planning, but it also means someone has to build and maintain the model.
For a professional services firm, Prophix’s biggest gap is the same one shared by most generic CPM platforms: it is not connected to what is actually being delivered, staffed, or billed. Firms that need broad budgeting and reporting across departments can get real value here; firms specifically looking for forward-looking, predictive forecasting tied to project economics will likely find themselves wanting more than the platform delivers out of the box.
Key Features
- Cube-based planning models: Flexible modeling structure that can be configured for financial, operational, or personnel planning.
- Automated workflows: Reduces manual steps in the budgeting and forecasting cycle once a model is built.
- Scenario and what-if analysis: Supports comparing multiple planning scenarios side by side.
- Cloud or on-premises deployment: Offers flexibility based on a firm’s existing IT infrastructure and preferences.
Pricing
Prophix is sold via custom, quote-based pricing that varies by deployment model, modules, and company size.
Datarails
Reviews: G2: 4.6/5, Capterra: 4.7/5.
Pros & Cons
Pros:
- Keeps finance teams inside existing Excel models. Datarails automates data consolidation and adds version control without forcing a rebuild of years of spreadsheet work.
- Reduces manual data pulls from multiple sources. Consolidation from disconnected systems into one model cuts down on the usual month-end spreadsheet assembly.
- Familiar to teams that are not ready to leave Excel. The learning curve is lower for finance teams whose institutional knowledge lives in spreadsheet formulas.
Cons:
- Pricing is not published and starts relatively high. Plans typically start around $24,000 per year, which is a meaningful commitment before a firm can fully test fit.
- Best suited to Excel-first SMBs, not services-specific forecasting. Datarails has no native connection to project delivery, billing, or resourcing data.
- Recent repositioning creates roadmap uncertainty. Datarails has shifted parts of its public messaging toward broader data infrastructure rather than traditional FP&A, which is worth watching for buyers planning a multi-year commitment.
Datarails is built for finance teams that have already invested years into sophisticated Excel models and do not want to abandon that work to adopt a new planning platform. Rather than replacing the spreadsheet, it layers automated data consolidation, version control, and FP&A workflows on top of the models finance already trusts, which lowers the adoption barrier considerably.
The limitation for professional services firms is the same one that shows up across most Excel-enhancement tools: the platform strengthens the finance team’s existing process, but it does not connect that process to project delivery, staffing, or billing data. Firms with strong existing Excel models and a need for better consolidation will find real value; firms that need forecasting built around project economics from the ground up will need a different foundation.
Key Features
- Excel-native FP&A layer: Enhances existing spreadsheet models rather than replacing them.
- Automated data consolidation: Pulls data from multiple sources into one model, reducing manual reconciliation.
- Version control: Tracks changes to models over time, reducing the risk of a broken or outdated forecast in circulation.
- FP&A workflows: Adds structured budgeting and forecasting processes around existing Excel-based work.
Pricing
Datarails does not publish pricing; plans are typically quote-based and often start around $24,000 per year, scaling with company size and data needs.
Cube
Reviews: G2: 4.5/5, Capterra: 4.6/5.
Pros & Cons
Pros:
- Spreadsheet-native FP&A inside Excel or Google Sheets. Cube reduces manual data tasks while letting finance teams keep working in the tools they already know.
- Real-time data pulls into existing models. Automated syncing cuts down on the manual copy-paste work that usually eats up a finance team’s week.
- Approachable for mid-market finance teams. Cube is generally seen as easier to stand up than heavier enterprise CPM suites.
Cons:
- No public pricing. Cube’s cost is not listed, which slows down early-stage comparison against tools with transparent tiers.
- Trails specialized tools on some forecasting-specific metrics. In head-to-head comparisons, Cube scores slightly behind more forecasting-focused competitors on budget creation and forecasting depth.
- No services-specific billing or resourcing logic. Like other spreadsheet-native tools, Cube models the numbers a finance team feeds it, not the underlying project delivery data.
Cube positions itself as a spreadsheet-native FP&A tool, letting finance teams work directly inside Excel or Google Sheets while the platform handles data consolidation and real-time syncing in the background. For finance teams that want automation without giving up their existing spreadsheet workflow, that is a real point in Cube’s favor.
The gap for professional services firms shows up in the same place it does for most general FP&A tools: Cube forecasts what finance enters, but it has no native visibility into project staffing, billing rules, or delivery data. It is a reasonable choice for a mid-market finance team focused on budgeting and reporting; it is a less complete answer for a firm that wants its cash flow and margin forecasts tied directly to what is happening on active projects.
Key Features
- Spreadsheet-native interface: Works directly inside Excel and Google Sheets rather than requiring a separate modeling environment.
- Automated data consolidation: Pulls data from connected sources into spreadsheet models automatically.
- Real-time insights: Refreshes underlying data so forecasts reflect current numbers rather than a stale export.
- Collaboration tools: Supports multiple contributors working from the same underlying data set.
Pricing
Cube does not publish pricing publicly; costs are quote-based and depend on team size and modules.
Planful
Reviews: G2: 4.3/5, Capterra: 4.3/5.
Pros & Cons
Pros:
- Strong multi-entity consolidation. Planful is built to handle dynamic budgeting, forecasting, and reporting across multiple business units and entities.
- Established platform for mid-market and enterprise finance. Planful has a long track record supporting more complex organizational structures.
- Broad reporting capability. Consolidated reporting across entities supports finance teams managing complexity at scale.
Cons:
- Pricing starts high and scales with complexity. Plans commonly start around $1,250 per month, moving Planful out of reach for smaller or mid-sized professional services firms.
- Longer implementation, often with multi-year contracts. Planful typically requires a more substantial rollout than lighter, purpose-built forecasting tools.
- Overkill for firms under roughly 100 employees. The platform is built for organizational complexity that most growing professional services firms have not yet reached.
Planful is an established enterprise performance management platform built around dynamic budgeting, forecasting, and reporting for organizations with multiple entities or subsidiaries. Its consolidation capabilities are a genuine strength for finance teams managing complexity across business units, which is exactly the profile it is built to serve.
For a mid-market professional services firm, Planful often represents more platform than the business currently needs, at a price and implementation timeline that reflect enterprise-scale requirements. Firms with 100 or more employees and multiple entities may find it a strong fit; smaller, growing firms typically get more practical value from a platform built closer to their current scale and connected to their delivery data.
Key Features
- Multi-entity consolidation: Rolls up budgets, forecasts, and actuals across multiple entities and business units into one consolidated view.
- Dynamic budgeting and forecasting: Supports building and adjusting budgets and forecasts as organizational structure changes.
- Reporting and dashboards: Provides consolidated reporting for finance leaders managing complex, multi-entity organizations.
- Workflow and approval routing: Supports structured review and approval cycles across departments and entities.
Pricing
Planful pricing typically starts at approximately $1,250 per month, with custom enterprise pricing for larger, more complex organizations.
Which Financial Forecasting Software Is the Best?
Here is the pattern that shows up once you line these platforms up side by side: almost any tool can produce a chart, but almost none of them connect that chart to the work actually driving the numbers. A forecast that does not know what is staffed, quoted, or billed is not really a forecast. It is a guess with a nicer interface.
BigTime is the best financial forecasting software because it does not treat forecasting as a chart bolted onto the business. It builds the forecast on the same financial system of record a growing professional services firm already runs on. Budgets, resourcing, billing, and cash flow forecasting all stay tied to the same GL-native data from quote to cash, making it a comprehensive solution rather than a single-purpose tool. Finance leaders get a rolling, current view of financial performance, and operational leaders get numbers they can actually trust because the numbers reflect what is happening on active projects right now, not what happened last quarter.
If your current process cannot keep up with your firm’s growth, do not wait for the next surprise on the cash flow statement to find out. Book a free personalized demo to see how BigTime connects forecasting to delivery.

Financial Forecasting Software: FAQ
What is financial forecasting software?
Financial forecasting software is a platform that helps finance teams project future revenue, expenses, and cash flow by combining historical data with current operational and transactional data. Instead of a static, manually built spreadsheet, it applies forecasting methods to financial data pulled from accounting software and other systems, producing rolling forecasts that update as new information comes in and give finance teams reliable financial forecasts to act on. Most platforms also support budget forecasting, scenario modeling, and customizable dashboards so finance leaders and business leaders can act on the numbers instead of just reporting them.
What is the best financial forecasting software?
BigTime is the best financial forecasting software for growing professional services firms because it connects the forecast to the same financial data driving delivery and billing, rather than treating forecasting as a separate exercise. Budgets, resourcing, and cash flow projections all pull from one GL-native financial logic, which means the forecast holds up as a firm adds more projects, more staff, and more complexity, instead of quietly drifting away from actual financial performance.
What is the best financial forecasting software for medium-sized companies?
For medium-sized companies, generally firms between roughly 50 and 250 employees, BigTime is the best choice because it is built for exactly this stage of growth. It gives mid-sized finance teams the forecasting depth of a larger platform, including rolling forecasts, budget tracking, and resource forecasting, without the multi-month implementation and enterprise-scale pricing that heavier corporate performance management suites require.
What is the best financial forecasting software for different industries?
BigTime is the best financial forecasting software across the industries that make up the professional services market, because its forecasting logic is built around project delivery and billing rather than a generic, industry-agnostic model:
- IT companies: BigTime connects resourcing and utilization forecasts to project billing, giving IT services firms a clear view of margin as engagements scale.
- Engineering firms: Budget and cash flow forecasts stay tied to project phases and cost types, helping engineering firms catch budget drift before it becomes a write-off.
- Consulting companies: Rate cards, utilization targets, and quotes all feed the same forecast, so consulting firms can forecast revenue and staffing needs from the same source of truth.
- Professional services companies in general: Any firm billing for time and expertise benefits from BigTime’s ability to connect financial forecasting directly to delivery data instead of a disconnected spreadsheet.
What is the best financial forecasting software that integrates with QuickBooks?
BigTime is the best financial forecasting software for firms running QuickBooks, with bi-directional, audit-ready integration with both QuickBooks Desktop and QuickBooks Online. Time, expenses, and invoices flow into the GL in real time, and AR status and adjustments flow back into BigTime, which keeps financial forecasts grounded in the same data finance already reconciles against.
What is the best cash flow forecasting software for professional services firms?
BigTime is the best cash flow forecasting software for professional services firms because its cash flow projections are tied directly to real project billing schedules, invoicing, and collections, not just a generic bank balance projection. That connection gives finance leaders an early warning system for cash flow that reflects what is actually being delivered and billed, rather than a cash flow forecasting tool bolted onto accounting data with no visibility into project work.
What is the best budget forecasting tool for growing firms?
BigTime is the best budget forecasting tool for growing professional services firms because budgets, actuals, and resource plans all live in the same system as delivery and billing. As a firm adds projects, clients, and headcount, BigTime’s budget forecasting scales with that complexity instead of requiring a firm to re-platform onto an enterprise system built for a different stage of growth.
Why is financial forecasting important?
Financial forecasting is important because it turns financial reporting into a forward-looking tool instead of a backward-looking one. Firms that skip it tend to discover financial outcomes only after they have already happened, from a missed cash cushion to a client concentration risk nobody flagged early enough. A dependable forecasting process gives finance leaders and business leaders the lead time to act instead of react, which is exactly why financial forecasting important to firms at every stage of growth, not just at budget season.
How does financial forecasting relate to budgeting and planning?
Financial forecasting and budgeting are closely connected but not identical. A budget is a plan for what a firm intends to spend and earn over a period; a forecast is a living estimate of what will actually happen, updated as new data comes in. The two should stay connected: when people ask how financial forecasting relate to annual planning, the honest answer is that a budget without a live forecast next to it is just a document nobody checks again after it is approved.