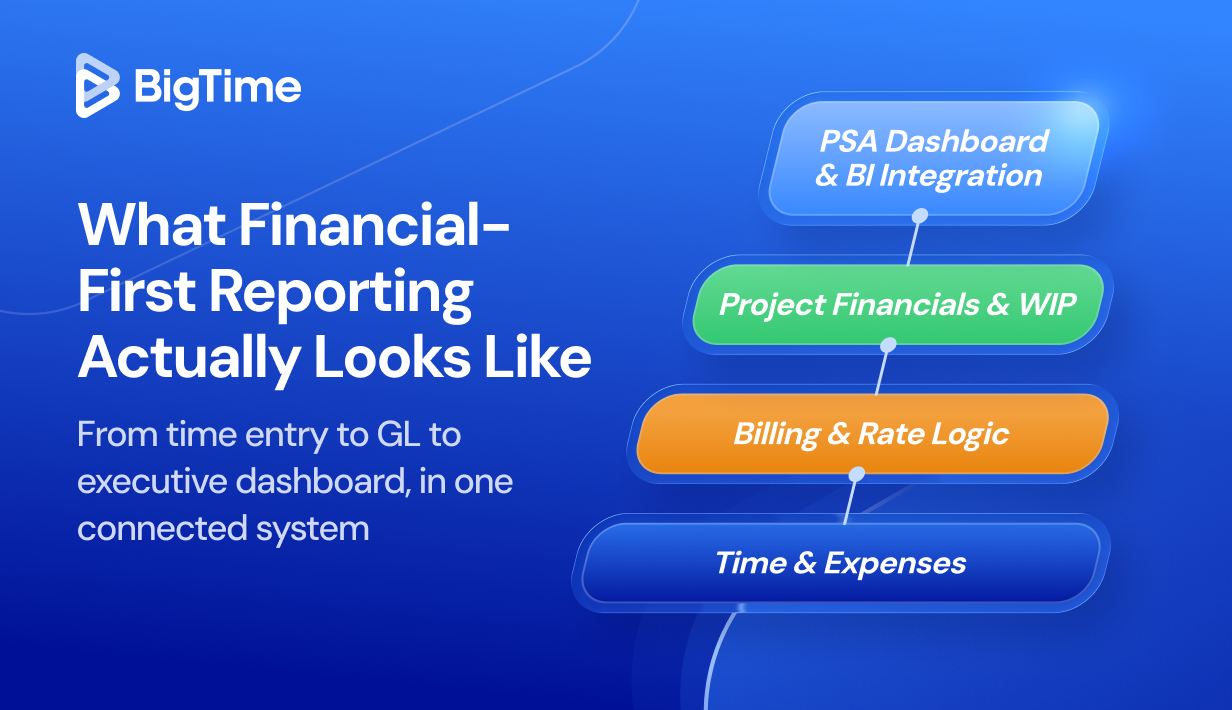
Finance Directors at professional services firms lose an average of five to ten days per month reconciling project data across disconnected systems, according to industry benchmarks. That is not a reporting problem. It is a visibility problem, and it compounds every month you go without fixing it. The right PSA reporting setup changes that.
When your time data, billing rules, and project budgets all live in one financial system, the numbers you see at month-end actually reflect what happened during the month, not what your team managed to piece together from three exports and a shared spreadsheet.
This guide covers the best PSA reporting and analytics tools available in 2026. Whether you are evaluating your first PSA platform or replacing one that no longer keeps up with your firm’s growth, you will find a clear comparison here, grounded in real product capabilities and customer outcomes.
What Is PSA Reporting?
PSA reporting refers to the collection, organization, and visualization of operational and financial data within a Professional Services Automation platform. Where a standalone reporting tool pulls data from wherever you point it, PSA reporting works from a single source of truth: the same system your team uses to log time, manage projects, track budgets, and generate invoices.
The practical difference matters for compliance, too. When your billing data, expenses, and project financials all live in one place, the reporting process is cleaner, more auditable, and far less vulnerable to the kind of missing or inconsistent data that creates risk at assessment time.
The Connection Between PSA Dashboards and Reporting
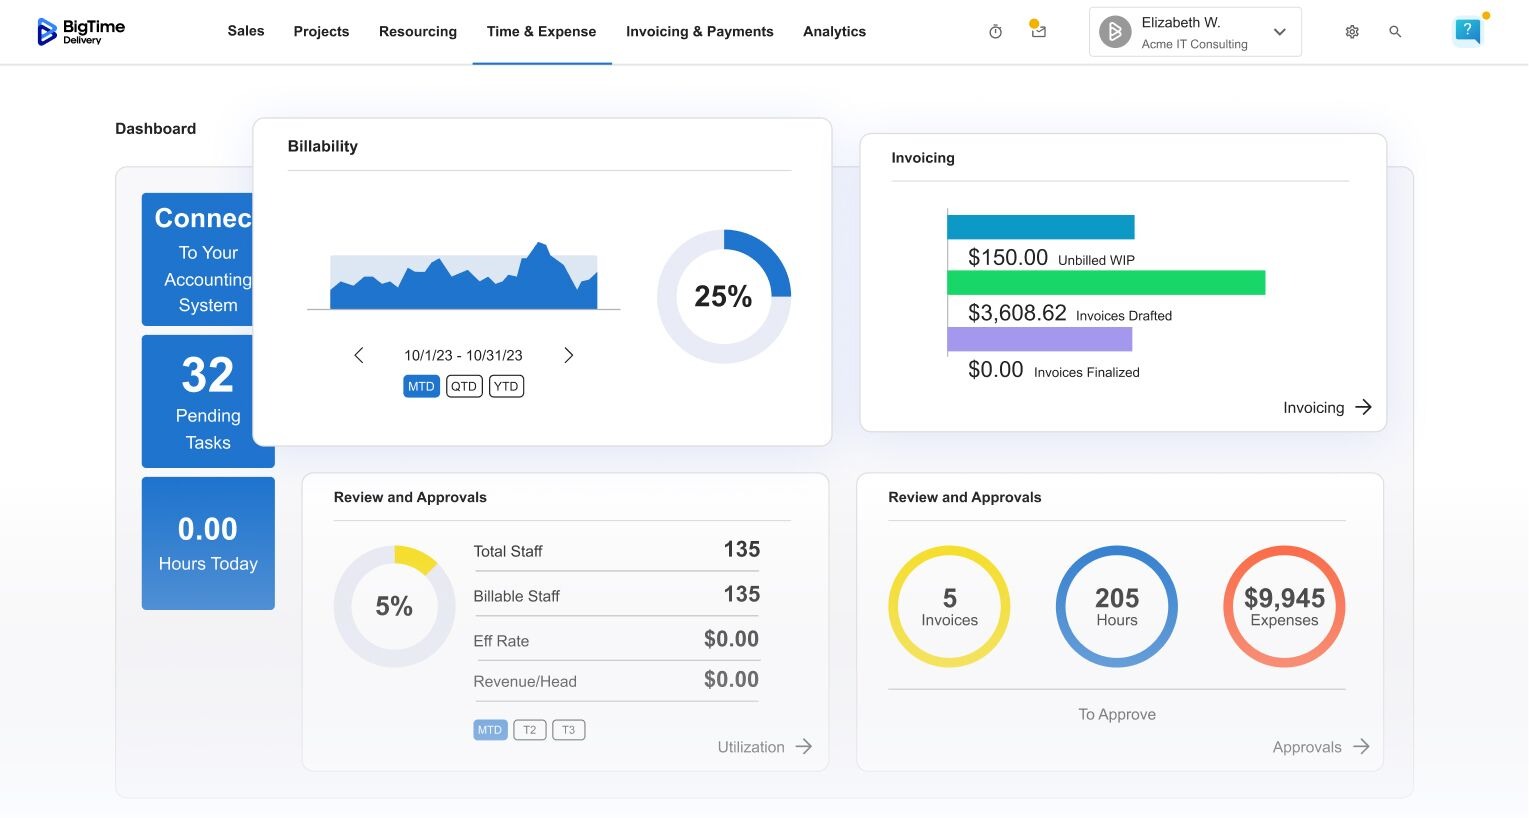
PSA executive dashboards and PSA reports serve different purposes within the same system. A PSA dashboard gives your team a live view of what is happening right now. PSA reports go deeper, covering a defined period and answering specific financial questions, such as which projects hit margin targets last quarter or where billing lag is driving up cost.
Together, they form the core of PSA reporting and analytics: one layer for ongoing visibility, one for structured financial analysis. The value of both depends entirely on the quality of the underlying data. Firms running on disconnected tools tend to find that their reporting is only as good as the last manual export.
Which Teams Benefit Most from PSA Reporting?
PSA reporting touches every part of a professional services firm, but the value is not evenly distributed. The teams with the most to gain are the ones currently spending the most time producing numbers manually.
Finance Directors and Controllers are the primary beneficiaries. Real-time WIP visibility, AR aging, and project-level profitability reports replace the month-end reconciliation cycle with a continuous, accurate picture of firm performance.
Operations and Delivery Leaders, on the other hand, use PSA dashboards to monitor utilization rates across their team, catch scope creep before it becomes a write-off, and track budget vs. actuals on active engagements. When process visibility is this immediate, the decisions that follow tend to be faster and more grounded in reality.
COOs and Managing Partners rely on PSA reporting to make resourcing and growth decisions backed by financial data rather than estimates. Headcount planning, resource forecasting, and margin trends all become accessible without a dedicated analyst or a reporting sprint at the end of each month.
The firms that see the fastest return from PSA reporting and analytics tend to share one characteristic: they are past the point where a spreadsheet can do the job, but not yet resourced to build a data team. A well-configured PSA report replaces both, and reduces the manual process overhead that quietly eats into profitability over time.
PSA vs. Standalone Reporting Software: Which Do You Need?
This is one of the more common questions growing professional services firms face, and the answer depends less on the size of your team than on how interconnected your reporting needs actually are.
Standalone business intelligence tools are – in some cases – genuinely powerful. If your data is clean, centralized, and stable, they can produce sophisticated PSA reports and dashboards. The challenge is that most professional services firms are not starting from that position. Their data lives across a time tracker, an accounting system, a project management tool, and several spreadsheets. Getting those sources to produce reliable, consistent reporting requires significant setup, ongoing maintenance, and usually a dedicated analyst to keep it working.
| Standalone Reporting Tool | PSA with Built-In Reporting | |
| Data source | Pulls from multiple disconnected systems | Single source of truth across time, billing, and projects |
| Setup requirement | High, requires data engineering or analyst | Low, data is captured as part of normal workflow |
| Real-time visibility | Depends on integration quality | Built in by design |
| Financial depth | Strong visualization, limited billing context | Full project economics including WIP, AR, and margin |
| Best for | Small firms or as a BI complement to a PSA | Growing firms that need reliable, connected reporting |
| Maintenance overhead | Ongoing, especially as data sources change | Managed within the platform |
A PSA platform with built-in reporting and analytics removes that dependency. The data does not need to be assembled before it can be reported on because it was never separated in the first place.
When a Standalone Reporting Tool Is Enough
A dedicated BI tool makes sense when your firm is small, your projects are relatively simple, and you have one person who owns the data infrastructure. If you are running a team of 10 to 15 people on a single contract type, a standalone tool connected to your accounting system may cover your reporting needs without the broader investment a PSA platform requires.
It also makes sense as a complement to a PSA, not a replacement. BigTime’s Data Hub, for example, gives customers direct access to raw financial and operational data for use in Power BI or Tableau, combining the depth of PSA reporting with the flexibility of a dedicated BI layer.
When a Full PSA Is the Right Call
Once your firm crosses the threshold where billing complexity, utilization tracking, and project profitability all need to be reported on simultaneously, a standalone tool starts to show its limits. The reporting is only as reliable as the process feeding it, and manual processes introduce errors that are hard to catch and harder to correct.
A PSA platform becomes the right call when:
- Your team is managing multiple projects with different rate structures and contract types
- Finance needs real-time visibility into WIP, AR aging, and budget burn, not a monthly snapshot
- Reporting delays are affecting the decisions your leadership team can make
- You are spending more time building reports than reading them
The firms that try to solve a PSA reporting problem with a standalone BI tool typically find that the tool works well until the data does not. At that point, the reporting is accurate enough to look credible but not accurate enough to act on, which is the most costly position a finance team can be in.
Common Reporting Challenges PSA Software Solves
Most professional services firms do not have a shortage of data. They have a shortage of data they can trust. The reporting challenges that push growing firms toward a PSA platform tend to follow a predictable pattern, and they get worse as the firm adds headcount and project complexity.
- Month-end close takes too long. When time data, invoices, and GL entries live in separate systems, closing the books becomes a reconciliation project. Finance teams routinely spend five to ten days per month on manual processes that reliable PSA reporting would reduce to hours.
- Project profitability is always a retrospective. By the time a traditional reporting cycle surfaces a margin problem, the project causing it is often already over budget. Real-time PSA dashboards show you a profitability risk on a Tuesday afternoon, not at month-end when it is too late to act.
- Utilization drops before anyone notices. Firms running on spreadsheets typically find out their utilization fell after the revenue impact has already landed. A PSA report on capacity planning and billing gives operations leaders a forward-looking view, not just a record of what already happened.
- Billing errors are caught after invoices go out. Incorrect rate cards and missing time entries are hard to catch when billing and project data live in separate systems. PSA reporting connects both, so anomalies surface before they reach the client.
- Reports take days to build. If producing a standard profitability summary requires pulling from multiple sources and validating everything manually, your reporting process is consuming time that should be going toward billable work.
The 5 Core Reporting Capabilities in a PSA
Not all PSA reporting is built the same way. The platforms that deliver real financial value share a specific set of capabilities, and the gaps between them tend to show up exactly when you need the data most.
Real-Time Project Financial Reporting
The foundation of any PSA report is project-level financial data: project budget vs. actuals, margin, burn rate, and WIP balance, updated as time and expenses are logged rather than at the end of a reporting cycle. Without this, everything else is analysis of the past.
Utilization & Capacity Reporting
A PSA dashboard built around utilization management gives operations and finance leaders visibility into how billable hours are distributed across the team, where capacity gaps are forming, and how current staffing decisions will affect revenue over the next 30 to 90 days. The firms that manage utilization proactively consistently outperform those that measure it retrospectively.
Billing & Invoicing Analytics
PSA reporting and analytics should cover the full billing cycle: time logged, WIP-to-invoice conversion, invoice status, and AR aging. When billing data is connected to project data in one system, the reporting process surfaces discrepancies before they become errors on an invoice, rather than after.
Customizable PSA Dashboards
Different roles need different views of the same data. A Controller needs AR aging and revenue recognition. A Delivery Lead needs budget burn and scope status. A Managing Partner needs margin by client and utilization by practice. A well-designed PSA dashboard makes all of these accessible without a reporting sprint or a data analyst in between.
BI Integration & Raw Data Access
For firms that need reporting depth beyond what any PSA can provide natively, direct access to raw financial and operational data is essential. The ability to connect a PSA to Power BI, Tableau, or similar tools without losing data integrity gives growing firms the flexibility to build the specific reports their leadership needs, on top of a foundation they can trust.
PSA Reporting Software: Side-by-Side Comparison
The table below covers the most widely evaluated PSA platforms for reporting and analytics in 2026. Ratings are sourced from G2 and Capterra.
| BigTime | Kantata | Accelo | Scoro | Rocketlane | Certinia | |
| Best for | Mid-market PS firms needing financial-first reporting | Enterprise PS firms on Salesforce | Small to mid-size service businesses | All-in-one ops for smaller teams | Client-facing delivery reporting | Enterprise Salesforce-native PS |
| Real-time financial reporting | Yes, GL-native | Yes, delivery-first | Limited | Yes | Limited | Yes |
| PSA dashboard | Highly customizable | Customizable | Basic | Good | Delivery-focused | Customizable |
| Utilization reporting | Yes, connected to billing | Yes | Yes | Yes | Limited | Yes |
| Billing & AR analytics | Yes, full cycle | Partial | Partial | Partial | No | Yes |
| BI integration | Yes, Data Hub (Power BI, Tableau) | Limited | No | No | No | Yes, Salesforce-native |
| AI-powered insights | Yes, AVA + Insights Engine | Yes, Expertise Engine | No | Yes, Scoro ELI | Limited | Yes, Agentforce |
| Implementation time | 30 to 90 days | 6 to 12 months | 4 to 8 weeks | 4 to 8 weeks | 2 to 4 weeks | 6 to 12 months |
| G2 rating | 4.5/5 | 4.1/5 | 4.4/5 | 4.5/5 | 4.7/5 | 3.9/5 |
| Capterra rating | 4.6/5 | 4.1/5 | 4.3/5 | 4.6/5 | 4.7/5 | 4.1/5 |
| Price range | From $20/user/month | From $59/user/month | From $24/user/month | From $26/user/month | From $19/user/month | Custom enterpri |
BigTime: Best PSA Reporting Software for Mid-Market Professional Services
G2: 4.5/5 (1,500+ reviews) | Capterra: 4.6/5 (700+ reviews)

Best For
Mid-market IT, engineering, and consulting firms that need financial reporting connected directly to their GL, not bolted on as an afterthought. BigTime is purpose-built for firms between 30 and 300 employees that have outgrown spreadsheets and disconnected tools but have no appetite for a six-month enterprise implementation.
Key Features
- GL-native financial reporting built around QuickBooks and Sage, so PSA reports on margin, WIP, and profitability match your accounting system without a manual reconciliation step.
- Configurable PSA dashboards by role, giving Finance Directors, Controllers, and COOs a live view of budget burn, utilization, AR aging, and project profitability.
- Utilization & capacity reporting connected to financial outcomes, showing how staffing decisions translate into margin and revenue forecasting rather than hours logged in isolation.
- Full billing cycle analytics covering time logged, WIP-to-invoice conversion, invoice status, and AR aging, all within a single financial system.
- BigTime Data Hub for direct access to raw data in Power BI or Tableau, combining native PSA reporting with the flexibility of dedicated BI tools.
- AVA, BigTime’s AI assistant, for natural language queries, billing anomaly detection, margin risk flagging, and auto-generated executive summaries.
PSA Reporting Details
BigTime’s reporting architecture starts where most PSA platforms stop: at the GL. While delivery-first competitors can add billing modules and QuickBooks connectors, they cannot retroactively rebuild their data model around financial continuity. BigTime’s reports on profitability, utilization rates, and cash flow are accurate because the underlying data was structured correctly from the first hour logged, not because a sync job ran last night.
Firms using BigTime report a three to five day reduction in month-end close time after go-live, driven by the elimination of manual reconciliation between their time tracker and accounting system.
Pricing
BigTime pricing starts at $20 per user per month. Modular structure means you pay for the solutions your firm actually uses. Contact BigTime for a tailored quote based on your team size and product combination.
Kantata
G2: 4.1/5 | Capterra: 4.1/5
Best For
Large professional services organizations already operating within the Salesforce ecosystem that need enterprise-grade PSA reporting tied to CRM data. Kantata suits firms with dedicated implementation budgets and IT teams to manage the rollout.
Key Features
- Salesforce-native reporting that connects CRM pipeline data to project delivery and financial outcomes.
- Expertise Engine for AI-powered predictive analytics on resource risk, project outcomes, and revenue forecasting.
- Utilization & capacity dashboards with scenario modeling across large, distributed teams.
- Pre-built PSA report templates covering project margin, billing performance, and resource utilization.
- Automated executive summaries generated from project and financial data across the portfolio.
PSA Reporting Details
Kantata’s reporting is delivery-first by design. Financial visibility is available but arrives through the project management layer rather than the GL, which means firms with complex billing structures may find themselves doing additional reconciliation work outside the platform. For organizations where Salesforce is already the operational center of gravity, that trade-off may be acceptable. For firms where the Finance Director or Controller drives the PSA decision, it is worth evaluating carefully.
Pricing
Kantata pricing starts at approximately $59 per user per month. Enterprise contracts are custom-quoted and typically include implementation and support packages.
Accelo
G2: 4.4/5 | Capterra: 4.3/5
Best For
Small to mid-size professional services firms looking for an all-in-one client work platform that covers CRM, project management, and basic financial reporting in a single interface.
Key Features
- Client and project reporting covering time spent, budget status, and billing summaries across active engagements.
- Revenue and profitability tracking at the project and client level.
- Utilization reporting for team capacity and workload management.
- Automated billing summaries connected to time tracking and project milestones.
- Pre-built PSA dashboards for project health and team performance.
PSA Reporting Details
Accelo positions itself as a delivery-first platform, and its reporting reflects that orientation. Financial reporting capabilities are present but less developed than platforms built around GL integration. Firms with complex billing models, multiple contract types, or a finance team that needs audit-ready data will likely find the reporting depth insufficient as they grow. For smaller firms with straightforward billing needs, it covers the basics well.
Pricing
Accelo pricing starts at $24 per user per month, billed annually.
Scoro
G2: 4.5/5 | Capterra: 4.6/5
Best For
Smaller professional services teams that want a visually polished, all-in-one platform covering project management, time tracking, and business reporting.
Key Features
- Scoro ELI, a natural language AI layer for querying project and financial data without building reports manually.
- Pre-built and customizable PSA dashboards covering revenue, project margins, and team utilization.
- Detailed time and billing reports connected to project budgets and client contracts.
- KPI dashboards for tracking firm-wide performance against targets.
- MCP connectivity for integrating external AI models with Scoro’s project data.
PSA Reporting Details
Scoro delivers strong visual reporting for smaller teams and is genuinely easy to get up and running quickly. The platform’s financial reporting is competent for straightforward use cases, but GL integration depth is limited compared to financial-first PSA platforms. Firms that prioritize QuickBooks or Sage connectivity as a non-negotiable part of their reporting infrastructure may find Scoro requires additional workarounds to maintain financial accuracy at scale.
Pricing
Scoro pricing starts at $26 per user per month, billed annually.
Rocketlane
G2: 4.7/5 | Capterra: 4.7/5
Best For
Professional services teams focused on client onboarding and delivery workflows where the primary reporting need is project status visibility for internal teams and external clients, rather than financial depth.
Key Features
- Client-facing project portals with real-time status reporting shared directly with clients.
- Delivery analytics covering milestone completion, project health, and team workload.
- Time tracking reports connected to project phases and deliverables.
- Agentic PSA features for automating delivery workflows and surfacing project risks.
- Utilization dashboards for tracking team capacity across active projects.
PSA Reporting Details
Rocketlane is built around the client delivery experience, and its reporting reflects that focus. It does well on project status, milestone tracking, and client communication, but financial reporting is not its primary use case. Firms that need margin visibility, AR aging, WIP reporting, or GL-connected analytics will find Rocketlane’s financial reporting capabilities limited. It is a strong tool for delivery teams; it is not a financial reporting platform.
Pricing
Rocketlane pricing starts at $19 per user per month, billed annually.
Certinia
G2: 3.9/5 | Capterra: 4.1/5
Best For
Large enterprise professional services organizations already invested in the Salesforce platform that need PSA reporting and financial management running natively within that ecosystem.
Key Features
- Salesforce-native PSA reporting with full CRM-to-revenue visibility across the project lifecycle.
- AI-powered staffing and delivery agents built on Salesforce Agentforce for automated workflow reporting.
- Revenue recognition reporting connected to project delivery milestones and billing schedules.
- Executive PSA dashboards covering portfolio-level margin, utilization, and cash flow.
- Compliance and audit reporting designed for enterprise governance requirements.
PSA Reporting Details
Certinia’s reporting is comprehensive within the Salesforce ecosystem, and for enterprises already running their business on that platform, the native integration removes a meaningful layer of complexity. Outside that context, the value proposition weakens considerably. Implementation timelines of six to twelve months, enterprise-level pricing, and a product built around Salesforce’s data model make Certinia a poor fit for mid-market firms that are not already Salesforce-native. G2 ratings also trail the category average, with customers frequently citing complexity and implementation difficulty as ongoing concerns.
Pricing
Certinia is custom-priced for enterprise contracts. Expect investment levels consistent with a full enterprise platform deployment.
What Is the Best PSA Reporting Software? Our Final Verdict
The right PSA reporting platform depends on one question: do you need reporting that looks good, or reporting you can actually run your business on?
Delivery-first platforms and standalone BI tools can produce impressive dashboards. What they struggle to deliver is financial accuracy without ongoing manual effort. When billing rules, rate cards, and project budgets share the same foundation as your reports, the numbers are reliable by design, not by reconciliation.
That is why BigTime leads this category for mid-market IT, engineering, and consulting firms. GL-native reporting, configurable PSA dashboards, AI-powered insights through AVA, and direct BI integration via Data Hub give growing firms the reporting infrastructure they need without enterprise complexity.
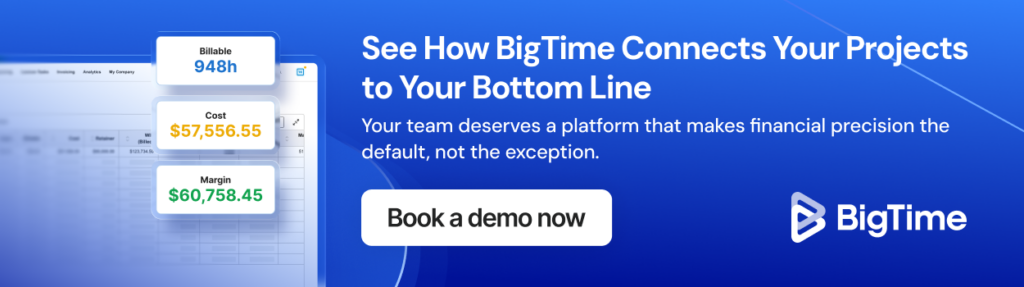
See how BigTime’s PSA reporting works for your firm. Book a demo now.
PSA Reporting by Use Case
Best PSA Reporting Software for Professional Services Firms
Professional services firms need reporting that covers the full project lifecycle, from the margin on a quoted engagement to the cash collected after delivery. BigTime’s GL-native architecture means every PSA report your finance team runs reflects a single, consistent financial logic across billing, utilization, and project profitability. For firms managing multiple contract types, complex rate structures, and a growing project portfolio, that consistency is what makes reporting actionable rather than approximate.
Best PSA Reporting Software for Consulting Firms
Consulting firms live and die by utilization and margin. The reporting challenge is not a shortage of data but a shortage of data that arrives in time to change a decision. BigTime’s real-time PSA dashboards give consulting leaders visibility into budget burn and billable hours as they accumulate, not at the end of the month when the opportunity to course-correct has passed.
Best PSA Reporting Software for IT Companies
IT services firms typically run a mix of T&M, fixed-fee, and retainer contracts simultaneously, which creates significant complexity at the billing and reporting layer. BigTime handles that complexity natively, connecting rate structures and contract types to financial reporting without requiring manual workarounds or parallel spreadsheets to keep the numbers straight.
Best PSA Reporting Software for Engineering Firms
Engineering firms need project financial reporting that tracks budget vs. actuals at a granular level across long, multi-phase engagements. BigTime’s WIP visibility and real-time profitability reporting give engineering leaders the financial picture they need to manage scope, protect margin, and report accurately to clients and stakeholders throughout a project’s lifecycle.
Best PSA Reporting for Small and Medium Businesses
For professional services firms under 200 people, the reporting infrastructure needs to be powerful enough to support growth without requiring a dedicated analyst to operate it. BigTime’s modular structure means smaller firms can start with core delivery and financial reporting, then add utilization, resourcing, and BI integration as complexity grows. No re-platforming required.
Best AI PSA Reporting Software
BigTime’s AI layer is built into the financial backbone of the platform, not added on top of it. AVA surfaces insights through natural language queries, flags billing anomalies before invoices go out, and generates executive summaries from live project data. Because the AI operates on GL-native data rather than a separate reporting layer, the insights it produces are grounded in the same financial logic that runs the rest of the platform.
Frequently Asked Questions About PSA Reporting
How Does PSA Reporting Improve Profitability?
PSA reporting improves profitability by making margin visible in real time rather than retrospectively. When budget burn, utilization, and billing gaps are visible as they develop, there is still time to act. Firms that consistently hit margin targets are not the ones with the best analysts. They are the ones with reporting that surfaces risks while a project is still in motion.
What Is the Difference Between PSA and Standalone Reporting Software?
Standalone reporting tools display data well but depend entirely on the quality of the sources feeding them. PSA reporting is different because the data never leaves the platform. Time entries, billing rules, and project budgets all live in the same system, so reports reflect the actual state of the business without a manual assembly process in between.
How Do You Choose a PSA with Strong Reporting?
Start with the data model, not the dashboard. Look for a platform where financial reporting is native to the architecture, not an add-on. Evaluate GL integration depth, whether billing and project data share the same financial logic, and whether the platform gives you access to raw data for external BI tools if needed.
What Is the Best Reporting Tool for PSA?
BigTime. Its reporting is built around the GL from day one, so PSA reports on margin, WIP, utilization, and AR aging are accurate by design. Configurable dashboards, AI-powered insights through AVA, and Data Hub integration with Power BI and Tableau give finance and operations teams a full reporting stack without requiring a dedicated analyst to maintain it.
What Is the Best PSA Reporting Software for Small and Medium Companies?
BigTime. Its modular structure lets firms start with core financial reporting and add utilization, resourcing, and BI integration as needs grow. The Excel-like interface drives fast consultant adoption, which directly improves data quality. Full time adoption within 30 to 90 days means your reporting is accurate from the first billing cycle, not after a lengthy implementation.