Last update: June 25, 2025
In the professional services industry, project management metrics are vital. However, it’s important to recognize that success goes beyond profitability and growth. Relying solely on these metrics provides only a partial view of performance. To dig deeper and gain comprehensive insights into what’s working and what might need improvement, firms should optimize all four metrics outlined below to ensure enduring success.
By focusing on all four of these project management KPIs, firms can proactively identify areas of strength and weakness, allowing them to make necessary adjustments to stay ahead of the curve. Here’s how to do that successfully,
In this article, you will learn:
- What are project management metrics?
- How to choose project performance KPIs and manage them successfully?
- What are the common key performance indicators (KPIs) for projects and its individual components?
- What project management tool can help you monitor all project metrics in seconds?
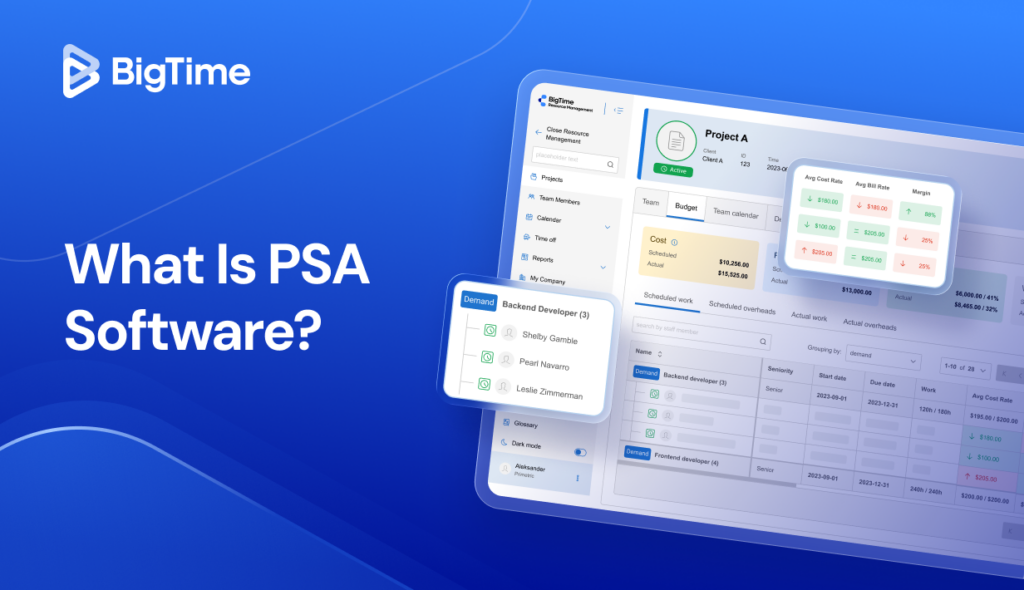
What are project management KPIs or metrics?
Project management metrics, also known as project management KPIs, are quantifiable results measuring the performance of your projects or its individual components, such as budget, productivity, or project progress. As a result, they can show project managers the effectiveness of their team in achieving project objectives and allow them to achieve project success regardless of the circumstances.
What are the benefits of project management metrics?
With project management metrics, you can:
- Make better decisions. Data should be the main driver of every decision made in professional services companies. By monitoring project management metrics, you ensure that you have all the information you need to make the right call, regardless of the circumstances.
- Mitigate risks. Unexpected changes and issues are not a problem – project management KPIs will inform you if there are any challenges coming your way before they impact your operations.
- Common goals for everyone. Project management maturity truly shows itself in working towards common objectives. These are usually set and measured by picking the project KPIs, which are essential for monitoring its progress.

How to successfully manage key performance indicators?
Creating a list of project performance metrics and KPIs does not mean that the metrics will actually reflect the progress you make. To ensure that this is actually the case:
- Choose the right metrics. Project management KPIs are not a one-size-fits-all. Depending on individual goals and aims, project management metrics can vary – and you should decide which ones to use based on the current condition your company operates in.
- Use the SMART framework. Whichever project management metrics you decide to use, you should always ensure that they are Specific, Measurable, Achievable, Relevant, and Time-bound. Avoid using vague metrics, such as improving performance or boosting profitability to give your project team a better idea of what they should strive for.
- Set realistic goals. It’s unlikely that your project margin will suddelny shoot up to 200%. Ensure that your goals are actually achievable to keep your team motivated, and your managers – happy.
- Monitor project performance. There are dozens of factors that can impact your project management KPIs, and you simply cannot predict all of them. Instead, regularly monitor your project to see if it’s delivered on schedule and alter your plans if necessary.
How to choose the right project management KPIs?
Selecting the relevant metrics for your project is not a one-size-fits-all exercise. To ensure your metrics support your goals, follow these principles:
- Align with business objectives. Every project is different. Your project management metrics should reflect what matters most to your organization and your clients. Are you prioritizing profitability, efficiency, client satisfaction, or quality? Let your goals drive your choice of metrics.
- Assess current challenges. Before selecting metrics, analyze where your projects tend to struggle. Is it scope creep? Delayed timelines? Poor resource utilization? Choose project management KPIs that help you monitor and address these pain points.
- Focus on actionable insights. A good metric is one you can act on. Avoid vanity metrics that look good but don’t inform real decisions. Instead, pick metrics that highlight opportunities for improvement and drive meaningful change.
- Balance leading and lagging indicators. While lagging indicators (like profit margins or final budget variance) measure outcomes, leading indicators (like planned vs. actual effort or schedule adherence) help you predict and influence future results. Choose a mix to get a complete picture.
TOP 25 project management metrics examples
Project management metrics are essential to improve project performance and achieve project goals. Still, there are so many of them – then which KPIs should you really choose?
Below you will find a list of the most popular project management KPIs, their types, and information on how to use them in practice.
Types of project management KPIs and metrics
While the list might vary depending on different methodologies, there are several types of project management metrics you might encounter. Those include:
- Schedule metrics that track project progress and help you monitor its performance against set project timeline.
- Resource metrics that track how effectively your team and other resources are being used.
- Budget metrics or cost metrics that assess whether your project is staying within budget. They ensure that spending aligns with plans and reveal financial risks before they escalate.
- Quality metrics that evaluate whether deliverables meet defined standards and client expectations.
Schedule project management metrics
Schedule variance
Schedule variance = Budgeted cost of work performed – Budgeted cost of work scheduled
Schedule variance is a project management metrics measuring the difference between planned and actual project progress at any point throughout its duration. A positive SV indicates that the project is ahead of schedule. Conversely, a negative schedule variance indicates that the project is behind schedule and, as a result, the project is at risk of being delayed.
Estimate to complete
Estimate to Complete (ETC) is an estimate of any remaining cost to be settled in a project. It is used to predict the actual cost of the project while it is already under way, using the data on incomes and expenses that we already obtained while the project is completed.
Time spend
Time Spent = Sum of all logged hours on the project
Time spent measures the actual hours your team has worked on the project so far. It’s essential to compare against planned hours to understand if you’re on track. Importantly, this project performance metric can be calculated both for the entire project and individual project milestones or tasks, depending on your needs.
Planned hours vs. time spent
Planned vs. Actual Ratio = Planned Hours / Actual Hours
Planned hours vs. time spent is a critical metric comparing estimated effort to the actual time logged by the team. This KPI can also help project managers identify delayed and problematic tasks, and manage them better in the future.
On-time completion percentage
(Number of On-Time Deliverables / Total Deliverables) × 100%
On-time completion percentage tracks how many tasks or milestones were delivered by their planned due date. Consequently, this metric helps evaluate scheduling accuracy and team performance across the project.
Scope creep percentage
(Number of altered tasks / Total number of tasks) * 100%
Sometimes project scope shifts – and that’s not a change you want to see in your project, as it might lead to delays in project delivery. Scope creep percentage, or the rate of changed tasks to total tasks, allow you to see the scale of this phenomenon and maintain project control in the future.
Schedule performance index
SPI = Earned Value (EV) / Planned Value (PV)
Schedule Performance Index measures how efficiently the project team is adhering to the planned schedule. An SPI above 1.0 means ahead of schedule, below 1.0 means behind.
Resource metrics
Resource capacity
Resource Capacity = Number of Team Members × Available Hours per Period
Resource capacity measures the total available work hours for your team in a given period. While it accounts for any planned absences, it does not include any existing assignments – it’s just a total number of hours an employee can spend working in a given period, usually a month or a week.
Capacity management, particularly for employees in higher demand, is one of the critical success factors for any project. After all, without the right people, achieving the desired project outcomes can be very unlikely.
Capacity vs demand
Capacity vs. Demand Ratio = Available Capacity / Required Demand
Capacity vs. demand compares the available hours against the hours required by projects. A ratio below 1 signals a need for more resources or reduced workload, indicating the need for new hires or external support or significant changes to project plan.
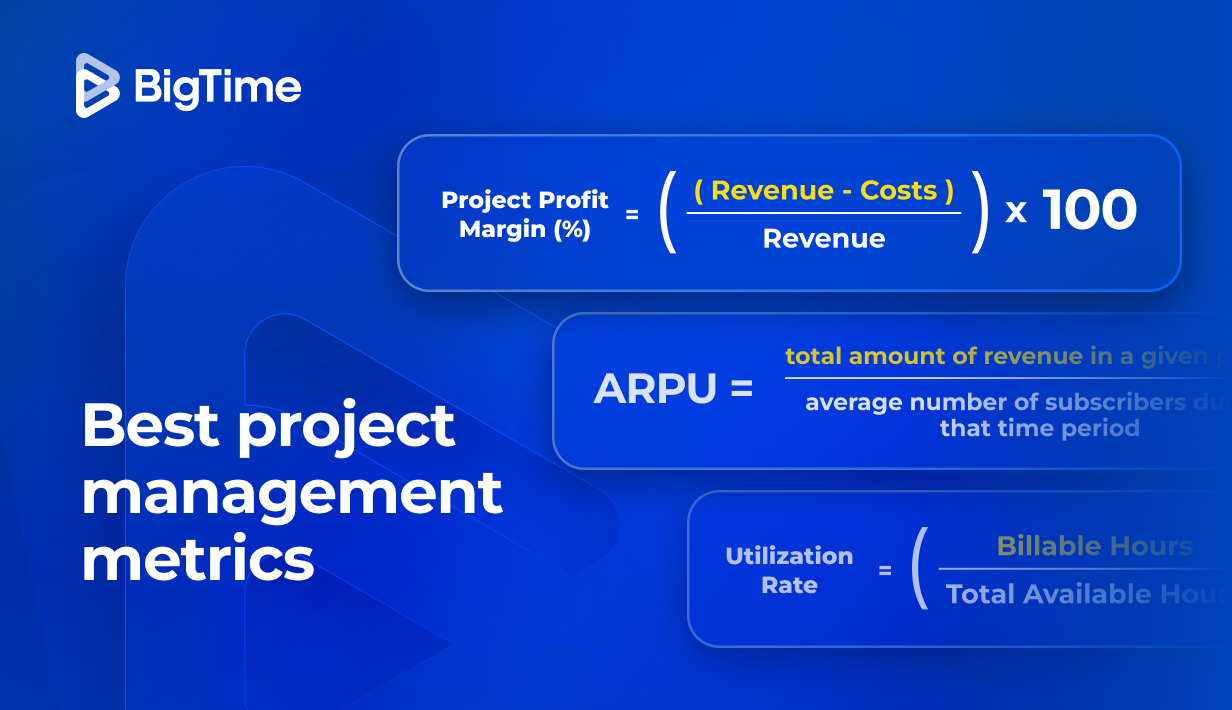
Resource utilization
(Actual Hours Worked / Available Hours) × 100%
Resource utilization is a project management KPI that measures how effectively your team’s available hours are spent on project work. Higher utilization indicates better efficiency but must be balanced to avoid burnout. Utilization rates above 100%, on the other hand, indicate schedule conflicts or a dire need for overtime in your company, and might increase actual project costs in the end.
Billable utilization
(Billable Hours / Total Available Hours) × 100%
Billable utilization tracks the proportion of time spent on billable work. This is essential for professional services firms aiming to maximize revenue. Too few billable hours in that formula might indicate that the company spends too much on initiatives that do not generate any profits, increasing overheads and making it more difficult for billable projects to break even.
Task allocation balance
Task allocation balance measures how evenly work is distributed across team members. This project management metric does not have a set formula; it is simply calculated by measuring the standard deviation of assigned hours across team members. A lower value indicates a more balanced workload, reducing the risk of overloading individuals, while higher value might point to the need for extensive workload management or even resource leveling.
Budgeting project management metrics
Cost performance index (CPI)
Cost Performance Index (CPI) = Earned Value (EV) / Actual Cost (AC)
Cost performance index is a project management metric that measures cost efficiency of your project – in particular, the efficiency of its expenses. A CPI over 1.0 suggests the project is under budget, while below 1.0 clearly shows the possibility of cost overruns.
Earned value
Earned Value = % of Completed Work × Budget at Completion (BAC)
Earned value is a project management KPI that measures the amount of work completed and its corresponding value against the planned work and approved budget, showing any discrepancies between planned and actual cost performance. As a result, it can be helpful in identifying several major issues with project execution, such as excessive spending and problems with achieving project milestones.
Cost variance
CV = Earned Value (EV) − Actual Cost (AC)
Based on the information on the earned value, project managers can assess performance of their project in even more detail using cost variance. This project management metric shows the difference between earned value and actual cost, highlighting budget performance and any related project health issues.
Positive cost variance indicates that the project is under budget, meaning the actual cost is less than the budgeted cost. Negative cost variance, on the other hand, should be worrying, as it indicates that the costs of work were bigger than the income it generated.
Resource profitability
Resource Profitability = (Revenue Generated − Cost of Resource) / Cost of Resource × 100%
Resource profitability evaluates profit generated by individual team members or roles. This helps optimize team composition and billing strategies while avoiding excessive spending on experienced, but expensive employees.
Gross profit margin
(Revenue − Cost) / Revenue × 100%
Gross profit margin tracks overall project profitability, crucial for business sustainability. Despite the popularity of this project management metric, it might be misleading when calculated without accounting for project and organizational overheads and the project’s overhead absorption rate, which should be included in overall costs of the project. Without information on this category of expenses, your gross profit margin might turn out to be surprisingly small – or even nonexistent.
Average cost per hour
Average cost per hour = Total Project Cost / Total Hours Worked
Average cost per hour is a project management KPI that helps understand overall labor cost efficiency and supports accurate project pricing. Just like in case of gross profit margin, remember to include project and organizational overheads in total project costs to ensure that your calculations are accurate.
Return on Investment (ROI)
(Net Profit / Total Investment) × 100%
Return on Investment (ROI) measures the overall financial benefit from the project relative to the cost invested. This project management KPI is often used to compare different projects or investments, but it can also serve as a project success metrics. The interpretation of this indicator is simple: the higher the ROI, the more profitable your investment was.
Quality project management metrics
Customer satisfaction score
(Sum of Customer Ratings / Number of Respondents) × 100%
Customer satisfaction score, also known as customer satisfaction index, measures how happy clients are with the project outcomes. Typically, this project metrics can be obtained by simply asking customers for their options, sending out simple surveys, or conducting designated interviews for more details. The higher the number, the better!
Net Promoter Score (NPS)
NPS = % of Promoters − % of Detractors
Net Promoter Score (NPS) is a project metric that evaluates customer loyalty and likelihood of recommending your services. It’s determined by asking customers how likely they are to recommend a company, product, or service to others, typically on a scale of 0 to 10. The score ranges from -100 to +100, with higher scores indicating greater customer satisfaction.
Employee churn rate
(Number of Departures / Average Number of Employees) × 100%
Customer satisfaction is not the only project management KPI that directly translates to quality; the opinions of your employees matter, too. Employee churn rate measures how often employees leave during or after a project, shedding some light on the quality of both project delivery itself and all your internal processes. High employee churn rates are a good reason to take a closer look at them.
Number of errors or delays
Number of errors or delays tracks quality issues that impact timelines and client satisfaction. While there’s no specific formula to calculate project management metrics, it’s easy to conclude that higher numbers of issues might indicate significant operational problems, while smaller numbers emphasize a high quality of your operations.
Rework percentage
(Hours Spent on Rework / Total Project Hours) × 100%
Reword percentage is an excellent project management metric that clearly highlights the proportion of work that needs to be redone for different reasons, such as errors or non-conformance. As a result, it can help project managers analyze project performance and identify processes that failed to contribute to project success in the first try.
Testing pass rate
(Number of passed tests / Total number of tests) * 100%
Testing pass rate refers to the number of test that were successfully passed. This project management metric is a clear indicator of a quality of individual project deliverables and can help you assess the quality of work performed throughout the project.
Delivery of key business objectives
(Number of Objectives Delivered / Total Objectives Planned) × 100%
Delivery of key business objectives measures whether strategic project goals were achieved. A higher number indicates that the majority of your project delivery processes work as intended. However, a sharp drop in that statistics, as well as low percentage of delivered objectives, might point to arising issues in key processes.
What is the future of KPI management?
As you can see on our complete list of project management metrics, there’s a lot of project data that needs to be considered to monitor the performance throughout the project lifecycle. Fortunately, monitoring them all in Excel spreadsheets can soon become a thing of the past due to significant changes in data collection and management we can expect in the future. Those include:
- AI-driven insights. With the further development of AI, project managers will soon be able to track project progress by asking their tools the right questions. Some project management tools, including BigTime, already use that technology to generate reports!
- Real-time updates. It’s hard to optimize resource allocation or profitability based on several outdated documents. The future of project management metrics lies in an automated approach with live updates, which guarantee the accuracy of all the data.
- Customizable digital environment. To optimize project performance, you need a complete overview for even the most complex projects – and that can rarely be achieved in just a single tool. The best ones should allow you to seamlessly connect with the solution you already know and like to allow you to create a bespoke digital environment.
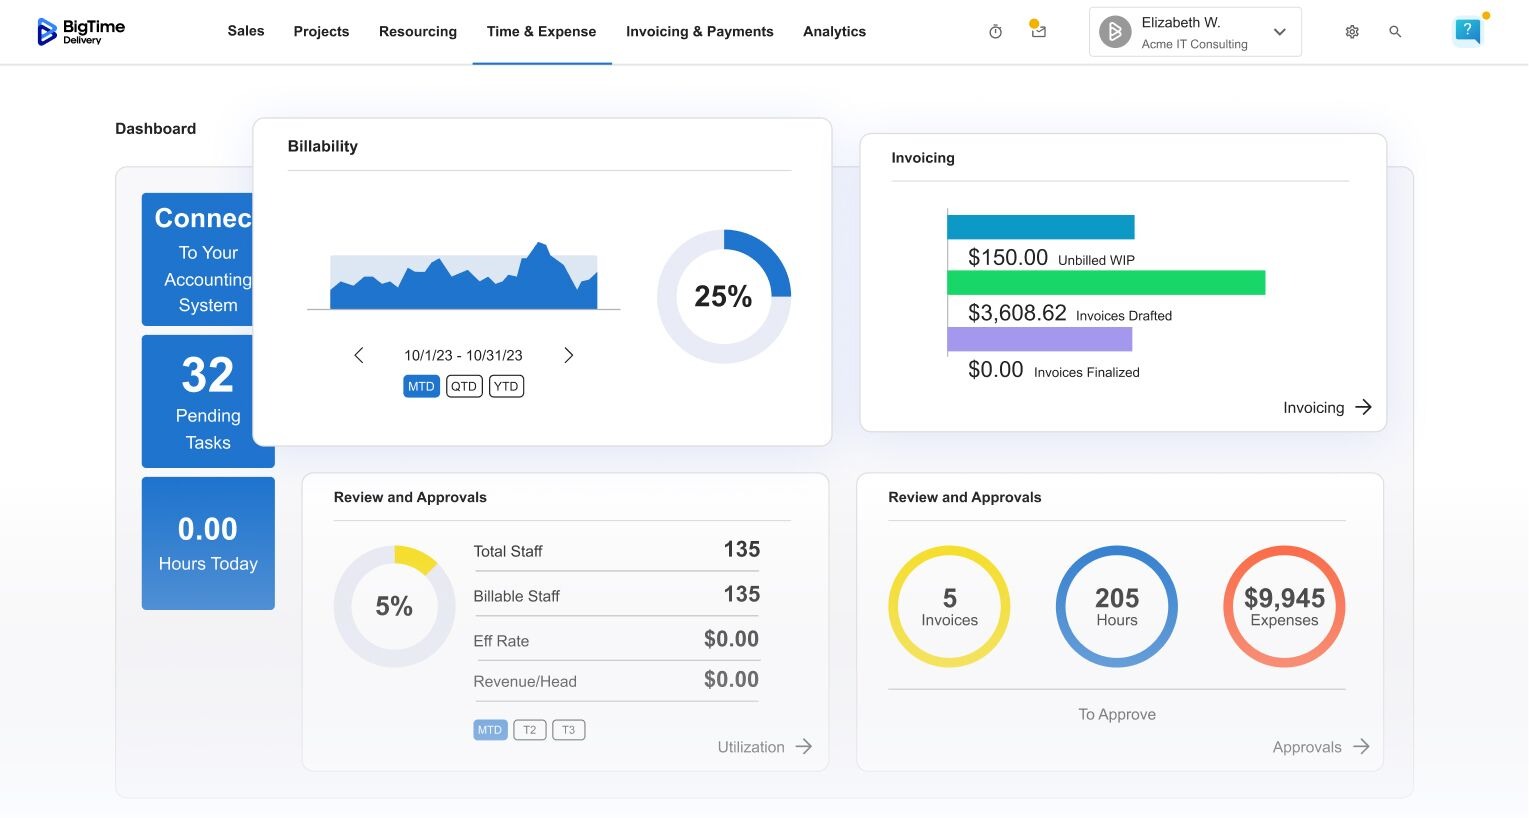
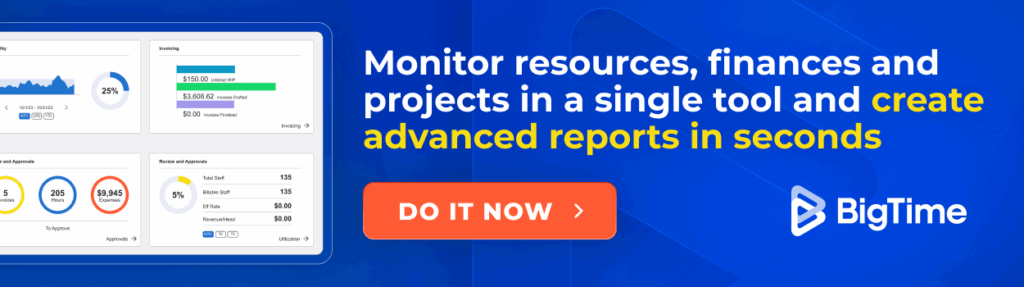
What tools can help you monitor project management metrics?
With so many project management KPIs at hand, it would be difficult to calculate them in a single Excel spreadsheet. Fortunately, there are other solutions that drastically simplify the process and reduce the amount of manual labour needed for reporting. BigTime is one of such tools.
In BigTime, you can:
- Create and monitor project budgets live, along with all the necessary KPIs, such as profit margins, overhead costs, and more.
- Assign people to project, create project schedules and monitor resource metrics every step of the way.
- Monitor project performance live, see the progress in the real time, and react to any unforeseen obstacles right away – no risks of delays included!
- Generate advanced reports for people, projects, and the company as a whole and create custom templates that fit your exact needs every time.
See how you can monitor project performance in BigTime in the demo below:
Want your project management success to become a certainty, and tracking key performance indicators to be finally easy? Book a demo with our experts right now or start a free trial to see what else we can do for you.