

Last update: July 1, 2025
Operating a professional services business without practicing revenue projection can feel like navigating in the dark. The lack of visibility makes it challenging to anticipate what lies ahead and what to plan for. For the professional services industry, where complexity and economic uncertainty are on the rise, having an accurate and up-to-date pulse on your financial health has never been more crucial.
In this article, we’ll show you how to hack revenue projection so you can see into your firm’s future without the help of a crystal ball.
What Are Revenue Projections?
These projections are essential for financial planning, strategic decision-making, and overall business management. For professional services firms, revenue projections help in anticipating future cash flows, setting project budgets, and aligning resources – all so critical in times of economic uncertainty.
How To Calculate Projected Revenue?
On paper, calculating projected revenue is simple, as shown by the formula below:
Projected revenue = Projected income – Projected expenses
Still, to make no mistakes in revenue projections, you will need a bit more data at your hand. To acquire it:
Estimate Expected Income
To begin projecting revenue, calculate the expected income from planned operations over a specific timeframe.
To do that, you’ll need to do the calculations twice – for the worst-case scenario and best-case scenario:
- Both confirmed and potential projects will be carried out, generating profits for the company (best-case scenario).
- Only confirmed projects will be executed and will generate profits (worst-case scenario).
For example, if your company has 5 confirmed projects that will generate $500,000 income and 3 tentative projects that will generate $300,000, your projected revenue calculations need to include both $500,000 and $800,000.
Calculate Projected Expenses
If you already know what your income for a given period is, you now need to determine the expenses your company will be covering in that same period.
To check that, you need to add:
- Estimated costs of work, based on the project schedule or project scope.
- The costs of any planned investments.
- Project and company overheads, including bills, taxes, and non-billable departments (i.e. marketing, sales, administration).
Just like in the example we shared in the previous step, you’ll also need to repeat the calculation for the worst-case scenario (with a maximum amount of costs) and the best-case scenario (minimum costs).
Subtract Expenses From Income
Once you have both your income and expenses calculated, you can start revenue projection for different outcomes – both the good and the bad.
You can test out different combinations here, but to get a fixed range of possible profits, simply:
- Deduct maximum expenses from minimal incomes.
- Deduct minimal expenses from maximum income.
By doing so, you will be left with a range of incomes you can expect in a given period.
Revenue Projection Models
If you want to delve into the details of your revenue projections further, you can also use one of the following models to enhance your projections and make them more precise.
Historical Forecasting
Use this revenue projection model if: you want a simple yet precise look at your company’s future.
This revenue projection model focuses on gathering past data, determining trends and tendencies, and projecting them into the future to estimate the key financial performance indicators of the company for the months to come.
However, this model is only effective for companies that track their operations in detail. If you are not one of them, do not try to come up with the data out of the blue. Instead, start gathering them for future periods.
Length of Sales Cycle Forecasting
Use this revenue projection model if: you are unsure of how much time it takes for your customers to purchase from your business.
The length of sales cycle forecasting shows you exactly when you need to acquire new customers. It covers the entire sales process, from initial outreach and evaluating options to paying for the services.
This indicator is particularly important for professional services companies, as it predicts when a new project will likely provide you with additional profits, making your forecasting that much more precise.
Test Market Analysis
Use this revenue projection model if: you are wondering whether a new market can power up your sales in the coming months.
With test market analysis, you can check whether the market you are aiming for is a good choice. By testing your product or services on a small scale, you can gauge if there is a significant interest in your offer and base your investment decisions on the information. As a result, you’ll get a sample that helps estimate potential profits from new business opportunities.
Revenue Projection Example
Professional services firms can choose from multiple revenue projection methods depending on their billing model and project structure. To illustrate how these formulas work in practice, let’s walk through a simple example using the Hourly Rate x Forecasted Hours approach.
Let’s imagine a Consulting Group – a mid-sized professional services firm specializing in IT strategy and implementation. Their projects typically span 6–12 months and involve billing clients on an hourly basis for consulting time. To ensure predictable cash flow and informed decision-making, Consulting Group wants to forecast project revenue for an upcoming engagement with a large healthcare client.
To do so, they need to:
Define Project Scope:
- Duration: 8 months
- Team Members: 3 Senior Consultants, 2 Junior Consultants
- Hourly Rates:
- Senior Consultant: $200/hour
- Junior Consultant: $125/hour
Forecast Billable Hours:
- Monthly workload estimates:
- Senior Consultants: 100 hours/month each
- Junior Consultants: 120 hours/month each
- Total forecasted hours over 8 months:
- Senior Consultants: 3 × 100 × 8 = 2,400 hours
- Junior Consultants: 2 × 120 × 8 = 1,920 hours
Calculate Project Revenue:
- Senior Consultant Revenue: 2,400 hours × $200/hour = $480,000
- Junior Consultant Revenue: 1,920 hours × $125/hour = $240,000
- Total Projected Revenue: $720,000
KPIs for Revenue Projections
You don’t have to repeat the calculations for revenue projections every time you want to check in on the results. Instead, you can also use some simplified KPIs that are capable of giving you a general idea of your future profits.
Annual Recurring Revenue (ARR)
Annual recurring revenue, or ARR, is the best choice for professional services companies that mostly offer time and material or retainer projects. It is the total amount of contracted revenue that your company brings in each year, or, in other words, what kind of income you can expect from your regular sources.
ARR can also be used to determine trends in the company and track its growth over the years.

Average Revenue Per User (ARPU)
Average revenue per user (ARPU) or average revenue per account (ARPA) helps you determine how much profit your company generates per every customer. This information can later be used for historical comparison and establishing a benchmark for profits per all customers.

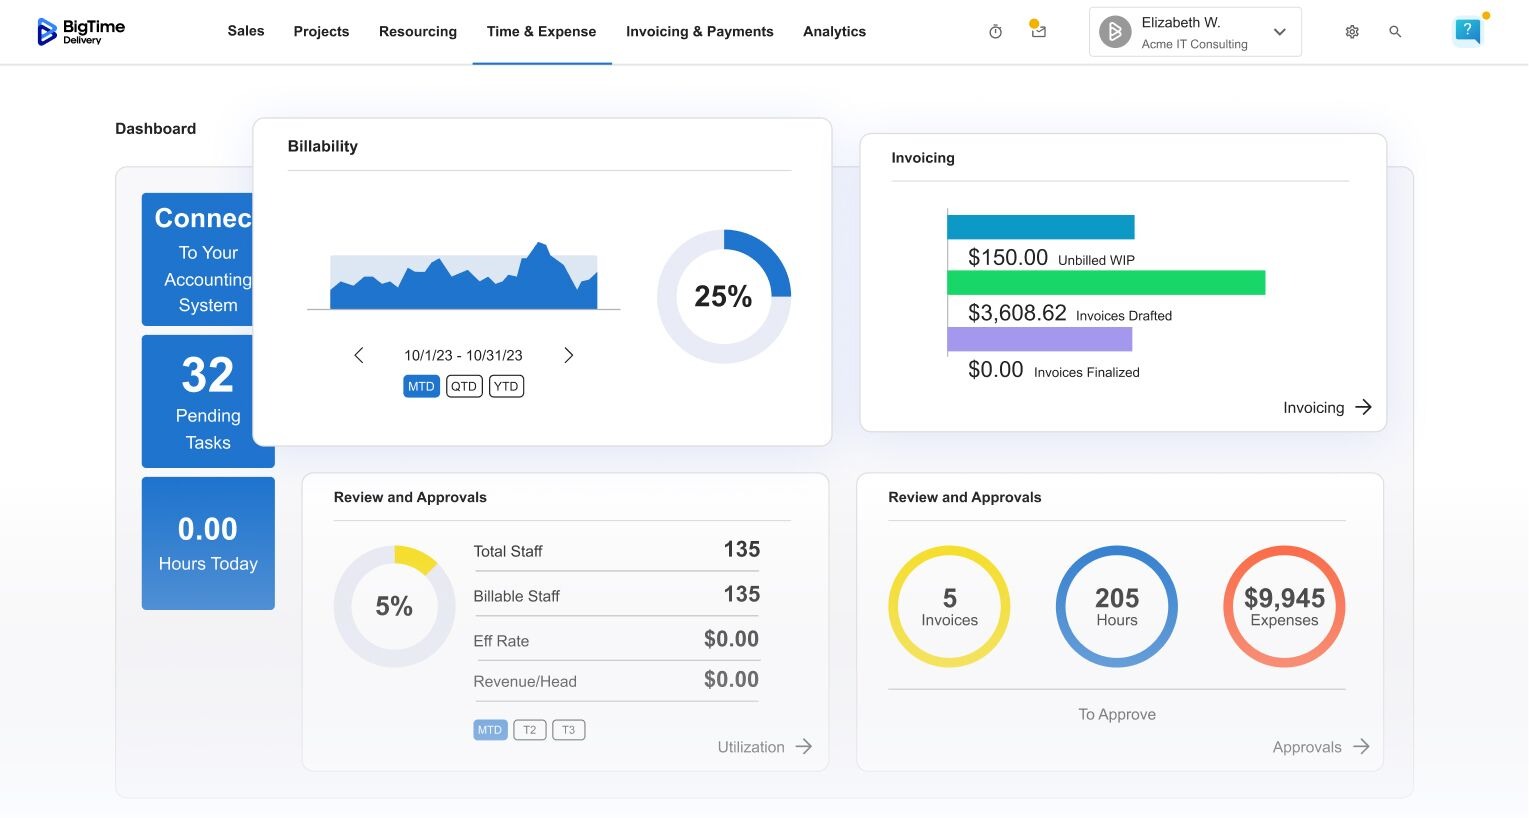
Revenue Projections Ready In Seconds? It’s Possible with BigTime
Fortunately, calculating projected revenue doesn’t have to take hours. With BigTime, it takes seconds.
In our system, you can seamlessly translate working hours into costs, and costs into invoices, reports and revenue projections – whatever you need to make the best decision possible.
Of course, that’s just a fraction of the capabilities of our tool. From resource management to advanced reporting, BigTime can help you manage all the key processes in your company, streamlining communication and reducing turnaround time – just like we did for PTC.
Want to see more of BigTime’s features? Book a demo with our experts to see how we turn raw data into actionable insights.