The success of the company is often measured in profitability. However, have you ever wondered what contributes to that profitability in the first place?
If you haven’t — or if you have, but you have not come to any conclusions — this article on financial performance is here to help you!
What is financial performance?
By definition, financial performance is a complete evaluation of a company’s overall financial health. In other words, financial performance measures how well a firm manages its assets — such as liabilities, expenses, and income — to achieve maximum revenue.
Financial Health vs. Cash Flow: What Does it Mean?
Here’s what a good company looks like compared to a company in bad shape:
Good Financial Health
- Good profitability resulting from closely monitored, profitable operations.
- Growing revenue and a growing amount of cash in company’s account.
- Liquidity guaranteed by cash reserve for at least two months of operations.
- Transparent spending and income based on budgets for each team/department.
Bad Financial Health
- Worsening profitability despite a growing number of projects.
- Growing revenue and minimal or decreasing amount of cash in company’s account.
- Liquidity issues and limited cash reserve.
- Spending and income from unknown sources, cannot be tracked to particular operations.
Financial performance can be used for both internal and external purposes. For the people involved in a company’s operation, the measurement determines the company’s well-being. However, it also provides investors and people from outside the company with valuable information on the investment potential of the business.
Why is financial performance important?
Measuring financial performance provides all the parties involved in a company’s operations with valuable insights regarding its past, present, and future.
On one hand, financial performance shows a company’s past standing, provides managers with key benchmarks for their business or its respective parts, and, last but not least, can be used to evaluate their work or the quality of their operations. It can act as a base for planning current endeavors and projects.
On the other hand, financial performance can also provide executives with insights into the future. It can help them determine overall trends in the business, analyze particular types of operations, and discover seasonal tendencies that affect the company. As a result, it can help managers check whether the company’s profitability, as well as other indicators, is on track to grow.
Financial Condition vs Profitability: Basic Approach
If you represent a professional services company, you probably consider net revenue a base for measuring financial performance. You’re not wrong — profitability makes up a huge chunk of financial performance, as long as it’s understood and calculated properly.
Let’s see how an expert approached this topic.
What is profitability in a professional service company?
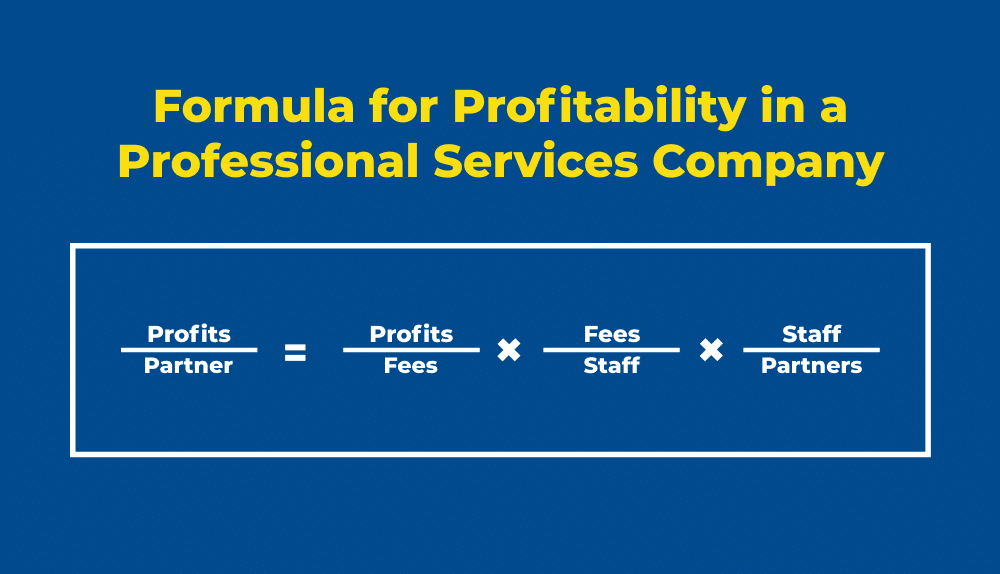
According to David Maister in his book “Managing the Professional Services Firm,” the ultimate measure of profitability is profit per partner. As simple as this definition may seem, it is not as one-dimensional as it appears. In fact, it contains three other main factors that we need to take into account. These are margin, productivity, and leverage.
As a result, the formula for profitability in a professional services company is:

To improve the profit per partner ratio, all the factors involved need to be improved. However, numerous companies fail to do that. Let’s see how that can change.
Profit Margins in Financial Performance
Net profit margin is generally what the companies focus most on — wrongfully so. For example, a well-managed company with low margins often earns more money than its counterparts with high-profit margins but lots of money running down the drain. Does this make net profit margin a reliable indicator? Of course not.
Net profit margin is mostly an indicator of productivity and leverage and rarely shows the condition of the company as a whole. The margin improves as the revenue per person (and per worked hour) grows, and the same happens when the ratio of staff to partners drops.
Then, why are margins relevant in the first place, and why does every income statement, cash flow statement, and balance sheet focus on them so much?
Profit margins also include overhead (the cost of offices, equipment, software, etc.) and, unfortunately, waste. Of course, the latter should be avoided at all costs, particularly by limiting excess space and equipment — and that is one of the best ways of improving profit margins and financial performance as a whole.
However, keep in mind that cost-cutting only affects cash flow statements in the short term; it is incapable of improving a company’s condition in the long run. Still, if you’re looking for quick cash, this might be the right action to take.
Productivity in Financial Performance
Productivity in professional services companies is usually defined as a ratio of fees to staff — or, alternatively, the value multiplied by utilization. Still, it is rarely brought up in income statements, or a company’s financial statements in general.
However, if you’re already somewhat familiar with the topic, you may ask whether it is the same as utilization. The answer to this question is no— utilization (sometimes also referred to as chargeability) is a short-run issue that does not affect the financial performance as a whole.
While you cannot improve chargeability itself (unless you convince your employees to work 24/7), it can be a base for other beneficial changes. When the value of every working hour grows, productivity also rises. Of course, this won’t happen on its own; processes such as specialization, skill building, innovation, and introducing value-added services are also factors.
Leverage in Financial Performance
Last but not least, revenue and financial performance are affected by leverage — the ratio of partners to staff.
However, while this definition may sound simple, the details are not as transparent. That’s because there is no single meaning of leverage for every company — it simply depends on the type of services and industry. For example:
- Highly specialized businesses (i.e., cutting-edge, high-risk companies) need to have a high partner-to-junior ratio.
- More general businesses that tend to focus on more repetitive actions need to have a low partner-to-junior ratio.
So, how do you improve the leverage of a company? The key is finding the right mix of skill levels to ensure both the quality and the quantity of all the operations in your business. Doing so can improve your profit margins and profitability as a whole, in both the short and long term.

How to Measure Financial Performance as a Whole
Now that the theory is behind us, we can move on to what should really interest you — the methods of measuring financial performance.
While there are many methods of measuring different aspects of various financial measures, only one can provide your company with a bigger picture of all the operations — the financial performance analysis.
What is a financial performance analysis?
Financial analysis is basically an audit that gathers financial information from the entire company to determine the profitability and general financial condition of the entire business. In other words, financial performance analysis can provide executives with answers to questions such as:
- What is the company’s financial position at this point in time?
- What factors have led to the current financial position of the company?
- What operations are most beneficial and most harmful to a company’s finances?
- How has financial performance changed over a certain period of time?
- What affects the cash flow statement, and why?
- What has driven changes in the finances of the company?
At the same time, it also analyzes key financial documents, such as the balance sheet, income statement, and cash flow statement.
Long story short, if you want to improve the financial performance of your company, financial performance analysis is for you.
Types of Financial Analysis
For the financial performance analysis to be accurate, it needs to focus on different areas of the business — that is why we generally divide the process into a few types. These include the analysis of:
- Working capital: The company’s current assets (i.e., cash and bills that are still to be paid by customers) minus inventory and current liabilities.
- Financial structure: Debt, equity, and overall financial liquidity in the company.
- Activity analysis: The analysis of operations impacting income and expenses
- Profitability analysis.
The analysis of all these fields and their current ratios combined can provide a company with a comprehensive view of all its operations and the costs that it generates.
Still, for a financial performance analysis to be accurate, you cannot just use any data you come across to draw conclusions. Such research needs to be based on accurate sources rooted in the actual projects and actions. In other words, that’s when you should first take a closer look at your company’s financial statements.
Measuring Financial Performance With Indicators — How to Do it
While financial statements are an excellent way to summarize a company’s operations over a certain period of time, they still require some input data that cannot be made up on the spot. On the other hand, companies with the best financial performance tend to monitor their financial progress more often.
While these two cases may seem to require different approaches, they, in fact, simply require the right measurements.
What are financial performance indicators?
Financial performance indicators (often referred to as KPIs) are quantifiable measurements created to monitor the well-being of a company’s finances.
Their main purpose may differ depending on the type of indicator you have in mind. Typically, they are used to track, evaluate, and determine the performance of the business as a whole or its particular elements, such as projects, teams, operations, and more.
Just like the performance itself, its indicators are crucial for both internal and external parties involved in a company’s operation. On one hand, they help managers monitor their business and keep an eye on assets, liabilities, key ratios, and more; on the other hand, they provide investors with valuable information they use to make their decisions.
Additionally, such metrics are often brought up in balance sheets, income statements, inventory reports, and other documents that matter for both managers and investors in the industry.
But let’s not focus too much on the theory — let’s take a look at the examples of financial performance indicators instead.
Financial Performance Indicators: Examples
Numerous financial performance indicators can be used almost universally, regardless of the type of company in question.
The most common metrics include:
- Gross profit: A company’s revenue minus production costs,
- Gross profit margin: A ratio measuring the company’s revenue minus its costs of sales, calculated by dividing gross profit by the revenue and multiplying the result by 100.
- Net profit: A company’s revenue minus all business expenses and taxes.
- Leverage: Total assets divided by total equity.
- Operating cash flow: Recurring incomes generated by repetitive or regular business operations.
- Debt-to-equity ratio: A company’s total liabilities divided by its shareholder equity.
- Working capital: Current assets minus current liabilities the money assets are financed with.
- Current ratio: Current assets divided by current liabilities.
- Inventory turnover: The number of times a company sells its average inventory in a fiscal year, calculated by dividing the cost of sales by the sum of beginning and ending inventory divided by 2.
- Return on assets: Net profit divided by half of the sum of beginning and ending assets.
- Return on equity: Net profit divided by shareholder equity.
All of these metrics often appear on balance sheets, income statements, or in reports summarizing total assets, working capital, inventory, status of management, and more.
Benefits of Measuring Financial Performance
After reading all this information, you may feel overwhelmed by the variety of factors your company needs to measure in order to monitor its financial performance. So, why is it worth the effort in the first place?
- No disappearing cash. Have you ever wondered what happened to the money that was once in your company’s account? With financial performance monitoring in place, you can see exactly which magic trick caused it to disappear.
- Wiser spendings. Monitoring financial performance can help you discover unexpected expenses you may want to avoid in the future. It is particularly helpful for monitoring finances in non-project departments, such as marketing, HR, or sales.
- No uncharted territory in your business. Introducing financial performance measurement in your company can help you track the operations and spending of all your teams and departments. There’s no room for the unknown in business.
- New opportunities at hand. Sometimes your financial performance may surprise you with some good news — you may have some extra money assigned to teams and departments that simply do not spend it. Use it for workshops, investments, or new hires and help your business grow even more.
- Realistic costs. We know that adding overhead to your budget may create some confusion. With financial performance measurement, you can see exactly how other spending increases your expenses in teams that actually generate revenue.


