Profitability isn’t a one-time fix. It’s a discipline. With the right tools and proven framework to embed in your workflows you will be able to turn margin preservation into a competitive advantage.
This step-by-step playbook is designed in a way to help you focus on high-impact metrics and the right dashboards so with less effort and a hands-on approach you will accurately hit your targets, reduce budget overruns, and improve profitability by up to 30%.

High utilization doesn’t guarantee profitability. Even with booked work, many professional service organizations operate at a loss. In the long-term, this will get your company out of business. To prevent that, you need to learn how to consistently improve profitability of your projects, clients, and the whole company.
It all starts with a profitability analysis: a regular exercise you can conduct using a PSA platform to help detect margin erosion, revenue leaks, and their underlying causes. The three core elements of profitability are:
- Tracking. Start by tracking data in real time. While it may seem obvious, you can’t improve profitability without knowing the current state of affairs. Tracking is the essential first step.
- Forecasting. Next, plan costs, revenue, and profits based on your sales pipeline, booked projects, and available resources. Initially, this may involve guesswork, but your forecasts will become increasingly accurate over time.
- Accuracy. Finally, ensure your predictions reflect reality. Greater accuracy means your forecasts align more closely with actual results, leading to a more predictable business.
Core Framework: 3-Step Profitability Analysis
1. Company Finances: The Big Picture
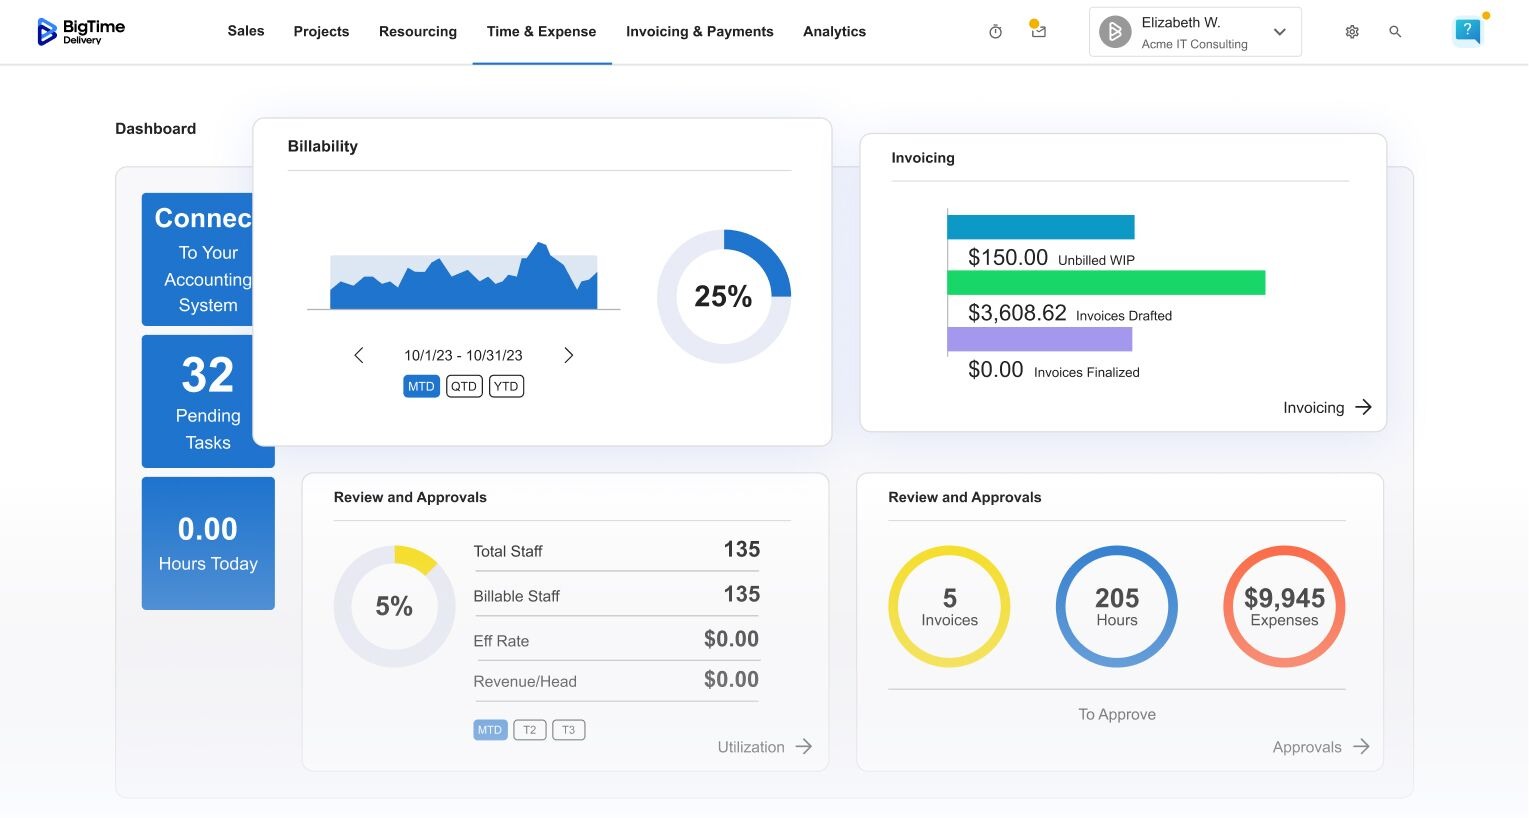
Start with the big picture by reviewing company-wide financial health. BigTime’s Project Finances provides unified visibility into costs, revenue, and profit, analyzing historical performance and projecting future outcomes. This includes all revenue streams: not just booked projects, but also deals at every pipeline stage to anticipate potential work.

How often? Monitor forecasts vs. actuals weekly and adjust frequency based on business size, deal complexity, and project length. Regular checks expose discrepancies in time, utilization, and margin, enabling actionable conclusions.
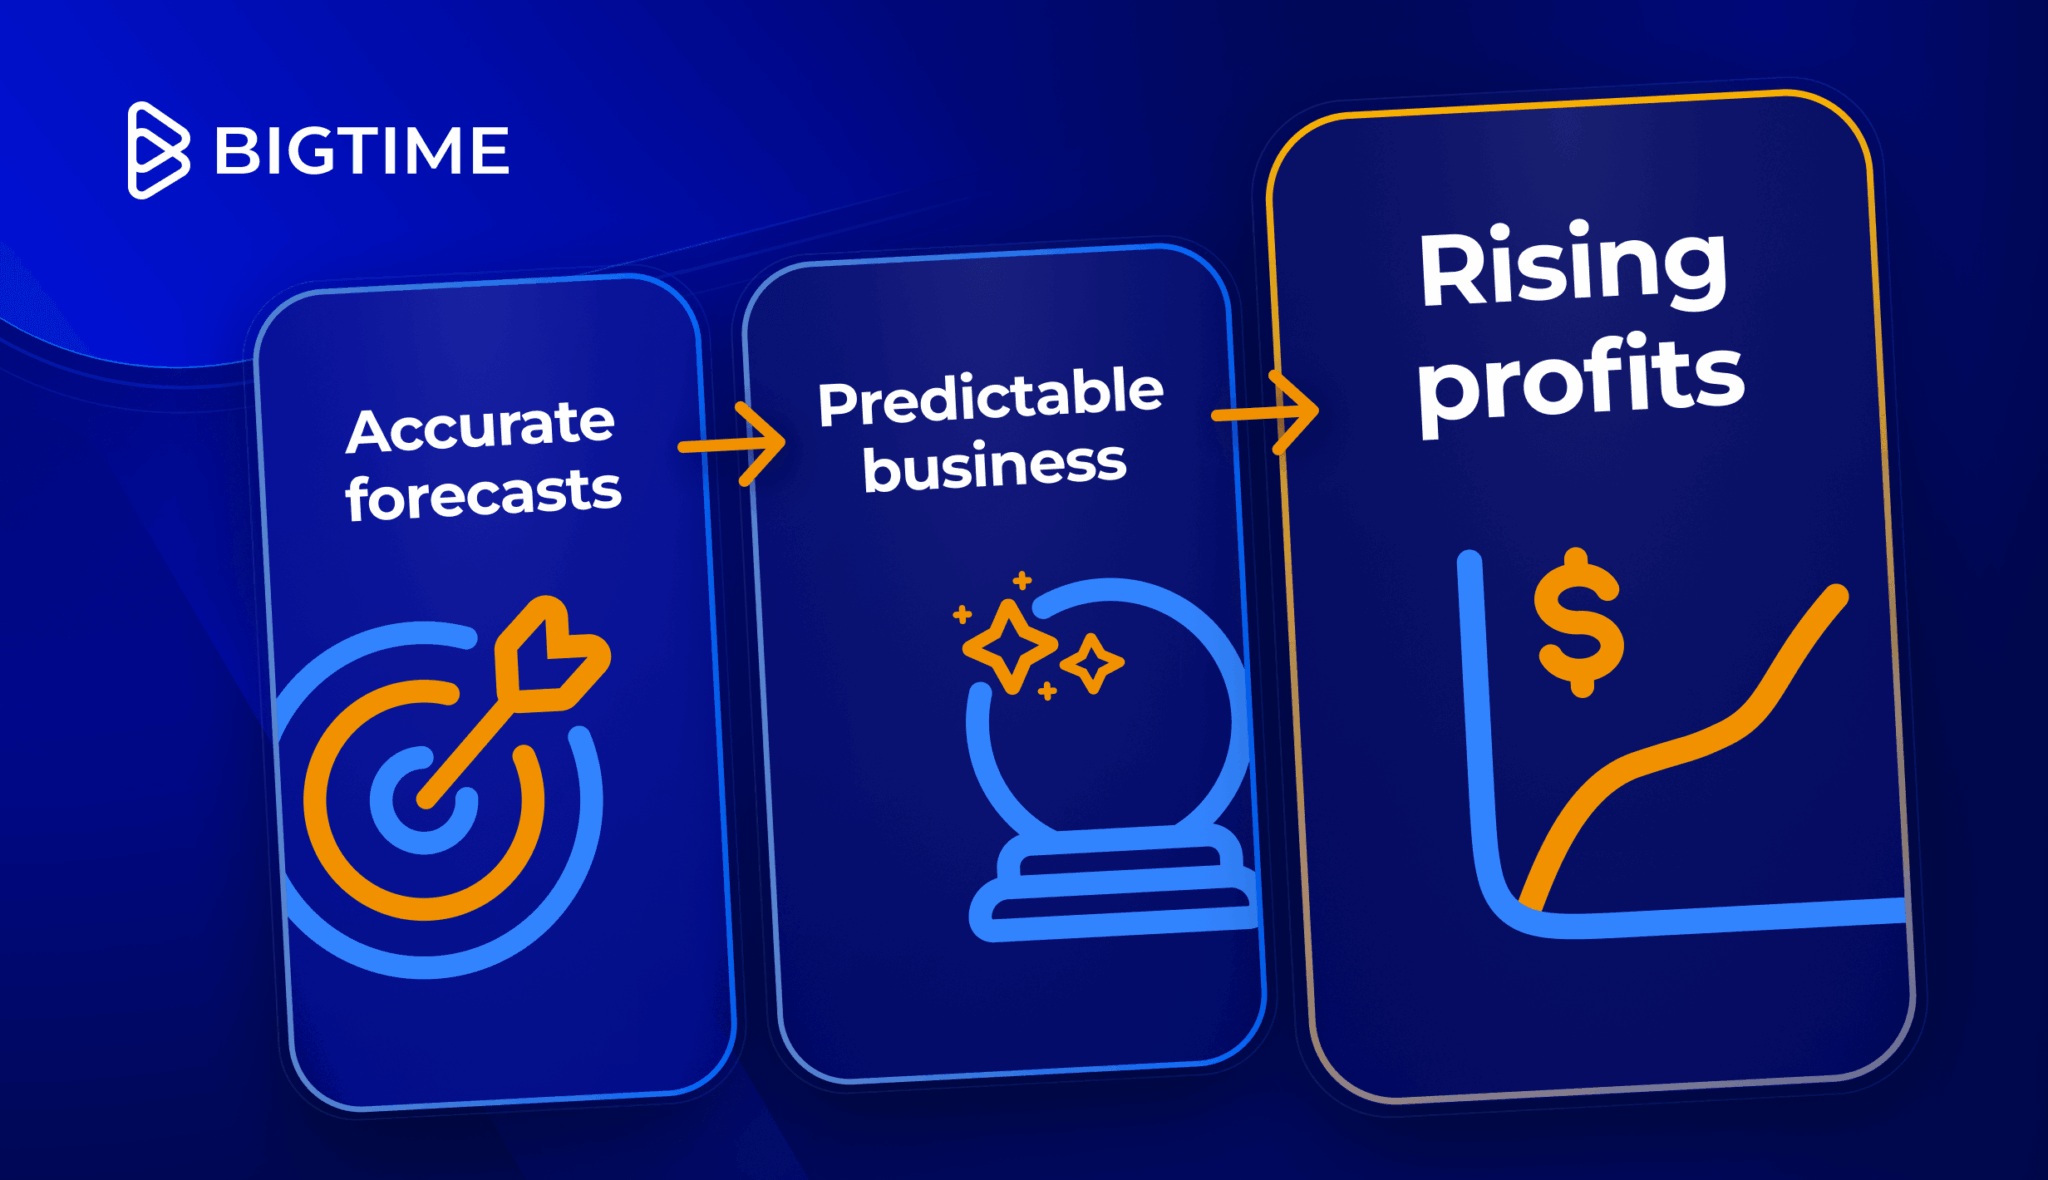
⚠️ Inaccuracies at the beginning of tracking are vital learning opportunities. Progress, not perfection: over time you will observe that forecasts become increasingly accurate.

With more accurate forecasts, your business becomes more predictable, reducing risks of:
- Understaffing leading to burnout, missed deadlines, and client penalties
- Overstaffing building wasted payroll
- Missed revenue targets
- Budget overruns eroding margins
- Trust erosion and negative client feedback
- Increased churn
After variance analysis, review the Utilization Report to see how divisions, departments, and specializations are utilized. For client-facing roles, billable percentage should be 75%-80% due to admin time, research and development, and staff resource development. The system accurately accounts for actual capacity, including time off.

2. Client Profitability: Segmentation
Client profitability requires strategic prioritization. Some clients may generate higher costs, operate inefficiently, or focus on low-margin service or product lines.
First, review all clients to identify the most and least profitable. You can quickly detect the top five performing projects and the five with the worst profitability by sorting them according to profitability. This should be followed by a detailed analysis of the root causes of underperformance.

After identifying the causes, address them directly. If issues remain unresolved, consider offloading these clients: reprice services, renegotiate contracts, or terminate relationships with chronic underperformers.

Additionally, analyze portfolios filtered by business line, specific Project Managers, Account Managers, or staff specialization. Using advanced filters, you can detect patterns where some services may be generating more overhead than profit. In these cases, it may be worth adjusting the pricing strategy, increasing rates, or discontinuing that service specialization.

How often? Examine each client monthly, aligning it with the billing cycle. Conduct portfolio-wide scoring with advanced filters quarterly.
3. Project Profitability: Optimization
Finally you can analyze individual project profitability. The BigTime dashboard provides deep insights into each project’s performance and offers a straightforward view of progress over time and how you’re tracking against targets. This is where you examine projects in detail to identify and resolve issues proactively.
It’s especially important to scrutinize the least profitable clients to identify root causes, such as:
- Unprofitable service lines
- Scope creep
- Excessive hours
- Low or outdated rates
- Underperforming or overpriced staff
This project analysis should include point-in-time financial reporting to monitor resource and budget forecasts across the timeline. Why does this matter? If a project grows more challenging over time while already exceeding planned resources, proactive intervention is critical. Reevaluate the scope early before it’s too late to course-correct.
For example: If a project’s resource-intensive second phase coincides with early overspending (e.g., 30% consumed vs. 20% budgeted), budget shortfalls become likely. Small variances can escalate rapidly, revealing hidden risks even in seemingly “on-budget” projects.
Detecting early budget risks enables proactive scope adjustments or resource reallocation.
You should also compare actual vs. budgeted revenue to track scope creep, write-downs, or overruns. Project evaluations help analyze margin erosion triggers and implement early prevention methods.
Drill down into individual project phases and assess the profitability of resources at different levels, such as specific people, roles, or seniority tiers. This is especially critical for Time and Materials (T&M) billing. Dashboards can highlight trends like underperforming phases or over-servicing by certain personnel.
Finally, analyze individual contributor profitability to identify gaps for specific contractors. By consolidating data across systems, you can track rate changes over time and assess their impact on project margins.
How often? Perform analysis weekly, adjusting for sprint length, project timeline, and team structure.
Profitability Analysis: Benefits in Action
Profitability analysis with your PSA platform is the foundation for improving forecasts, boosting utilization, and increasing profitability. Small process tweaks combined with disciplined KPI tracking drive tangible results.
While it’s difficult to attribute outcomes to any single analysis component, the combined effect delivers:
- 30% higher forecasting accuracy
- 25% profitability lift for individual projects
- 22% more frequent revenue target achievement
Success isn’t about perfection—it’s about continuous improvement. Over time, you’ll:
- Attract larger clients
- Phase out unprofitable service lines
- Minimize bench time
One of BigTime clients, Billennium achieved:
- Record-breaking utilization
- 14% utilization boost through improved planning
- Reduced bench time and costs
They achieved full platform integration in just 3 months, despite the complexity of deploying across 1,500+ employees that required seamless system functionality and smooth change management execution.

Start Profitability Analysis Today
Profitability is built on consistency. It starts with tracking real-time data, building forecasts using integrated sources, and continuously optimizing to refine accuracy with each cycle.
This playbook was designed by practitioners with 20+ years of experience across 3,000+ professional firms globally. Its power lies in its simplicity. Consistently apply these core principles, and you can boost profitability by up to 30% within months.
Ready to begin? We’ll help you configure dashboards and guide your first profitability analysis steps. Book a demo to see it in action.