
In recent years, economic turbulence has been evident, impacting various industries, including professional services organizations. If this time has taught us anything, it’s to be prepared for anything. With so many varying (and often unpredictable) factors impacting revenue including staff, sales pipeline, project revenue, and more, professional services firms may be wondering — do we have enough money to get through this?
In this article, we’ll cover exactly what you need to keep in mind when trying to find that answer. From calculations to often-overlooked cost expenditures, it’s all here.
How much money should a professional services company have in their bank account?
While it might feel obvious, this question starts with knowing what is in the bank. However, don’t let an overflow of cash fool you.
Start by calculating all the costs needed to be covered every month (we’ll help you break down these costs later on) and ask yourself — how long would that money last if the company suddenly loses all of its income?
The right answer to this question for professional services companies employing under 50 people is at least three months. However, for bigger organizations, this number can be different due to a variety of factors.
Why do companies keep exactly that much money? First and foremost, the sales cycle generally lasts for three months (or, in some cases, a bit more). Therefore, having money for that much time can help your business pull through and acquire new projects in case of any issues.
Secondly, having three months buffered in also gives the company plenty of time to collect any outstanding debt and settle with customers. In other words, that’s enough time to find some additional needed funds.
Calculating Expenses at a Professional Services Organization
Before starting to improve revenue, professional services companies need to determine what costs their business has to cover to break even.
Profit Margins
Profit margins represent the difference between revenue and costs, so any changes in costs directly impact profitability. Profit margins are often categorized based on different levels or components that help analyze various aspects of a company’s profitability.
Here are some common types of profit margins:
Gross margin: This represents the percentage of revenue that exceeds the cost of goods sold (COGS). It reflects the efficiency of production and pricing strategies.
Operating margin: This margin considers operating expenses (beyond COGS) like salaries, rent, utilities, and marketing. It indicates how well a company’s core operations generate profit.
Net margin: Also known as the bottom line, the net margin accounts for all expenses, including taxes and interest. It provides a comprehensive view of overall profitability.
Contribution margin: Often used in break-even analysis, this margin focuses on the variable costs associated with producing one additional unit of a product. It helps determine the amount available to cover fixed costs and contribute to profit.
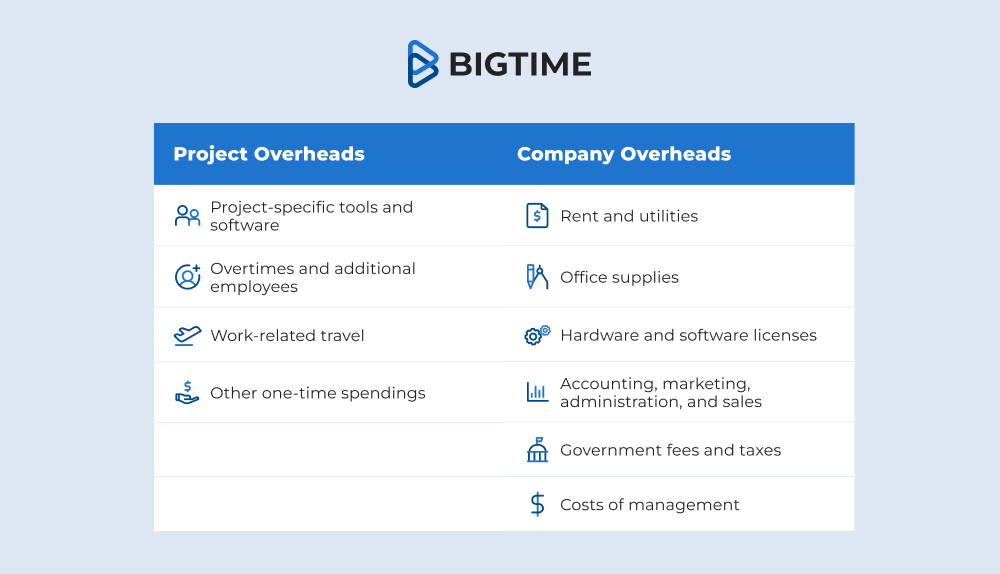
Overhead Costs
Overhead costs are all the continuing expenses of running the business, excluding the direct costs of developing a product or providing a service.
Both companies as a whole and individual projects can generate overhead. However, project overheads can only be included in the budget of a given project, while company overheads are shared between all billable projects.
It’s important to note that both project and company overheads affect how much profit a project makes and the overall profitability of the company, but they do so to different extents.
Calculating Project Overhead
Additional project costs need to be divided by the number of hours it’s expected to take. For example, if the project is estimated to be completed in 500 hours, and its additional costs are $750, the project overhead per hour is precisely $1.50.
Calculating Company Overhead
The easiest way to calculate these costs is to divide the sum of all company-wide costs by the total number of hours in all billable projects.
To illustrate this example, let’s imagine a small company that works on 3 projects:
Project A is scheduled for 300 hours per month
Project B is scheduled for 200 hours per month
Project C is scheduled for 500 hours per month
The company expects to generate $2,000 in organizational expenses in the same month. Therefore, the overhead cost per hour is $2. Then, both of these types of overhead need to be summed up. In this case, the total overhead cost is $3.50 per hour.

Cost Allocation Formula
For every project, a share of the overhead is allocated, and the distribution is straightforward. However, when it comes to sharing the costs of company overhead between projects, small operations cannot cover as many expenses as their bigger counterparts. How can we split the costs among different operations without making them unprofitable? That’s what the cost allocation formula is for.
Cost allocation matches the projects with the departments or operations that generate them. In other words, it allows managers to calculate the share of overhead their project has to cover based on the resources they use.
Step 1: Define which costs you want to allocate.
First, calculate the costs to be allocated by adding up all the costs you want to divide between the projects.
For the sake of this example, let’s assume that The Best Company is focused on allocating the costs of their support departments to the projects for the month. The costs include:
- The costs of the sales and marketing departments= $40,000
- The costs of benched employees= $15,000
- The costs of management and administration= $45,000
Together all of these departments account for $100,000 of overhead expenses that need to be allocated.
Step 2: Determine the base for sharing the costs.
Depending on the type of business, the costs can be divided based on different factors. The most popular ones include:
- The amount of billable hours tracked for each service
- The amount of income generated
- The amount of profit generated
Let’s begin with the first of the indicators listed — billable hours. This method is considered the simplest for allocating costs proportionally and is widely used in professional services companies.
For example, The Best Company has 2 projects, Project A and Project B.
To complete Project A for the month, the team will work for 1,800 hours.
To complete Project B for the month, the team will work for 1,200 hours.
Both projects combined require 3,000 hours to complete. Therefore, Project A accounts for 60% of all billable hours in the company, while Project B includes only 40% of them. These are the proportions we will use in the cost allocation for this method.
Step 3: Allocate the costs proportionally.
According to the example above, the total cost to be shared between billable operations is $100,000.
Project A requires more hours, therefore it should pay for a larger chunk of the costs, precisely 60% of them. Which means $60,000 of costs are allocated to the project.
Project B, on the other hand, only requires 40% of all the billable hours. Therefore, it should pay 40% of the costs which comes out to $40,000.
Step 4: Determine the profitability of your project.
Let’s now look at the impact of these overhead amounts on the projects using the example of Project A.
This project needs to cover $60,000 of overhead each month. Every month, the company receives $150,000 for work on this project. The work is estimated to cost around $50,000.
After deducting the costs of work and overhead from the income generated, the project realizes $40,000 in profit. Therefore, its final profit margin is around 26%, which is perfectly adequate to keep stakeholders happy.
What can affect the future profitability of my project?
Your company’s overall net profitability is not the only thing you should care about. Before you start rummaging through the financial statements, follow the methods below to check whether or not your project is profitable — and will remain so in the future.
Cost Performance Index
The Cost Performance Index (CPI) is a measure used in project management to assess the efficiency of cost performance on a project. It’s calculated by dividing the earned value (the budgeted cost of work performed) by the actual cost of work performed.
In essence, the CPI indicates whether a project is under, on, or over budget at a particular point in time. A CPI value greater than 1 indicates that the project is under budget, while a value less than 1 signals that the project is over budget.
Cost Performance Index Example
Let’s assume that project A is halfway to completion. It was planned to take 1,600 hours. However, completing the work up to this point took 750 hours. Therefore, we have to multiply the progress (in this case, it is 0.5, because 1 stands for a fully completed project) by 1,600 estimated hours, and then divide the result by 750. In this case, the CPI is 1.07 — the project has used 7% more budget than it was supposed to.
What awaits me in the future?
While the future is unpredictable, it’s important to remember that professional services firms are often the first to bounce back once the economy begins to improve. To help stay ahead and keep a real-time pulse on financial insights, turn to Professional Services Automation (PSA) software like BigTime. By gathering and organizing financial data, BigTime offers valuable insights into past performance and current trends. Its customizable and real-time reporting capabilities empower customers to project future revenue based on historical data and anticipated changes.