Project management analytics turns everyday project data into practical signals you can act on. Instead of relying on gut feel or scattered status updates, you use data analytics in project management to spot patterns early, track project performance in real time, and make data-driven decisions that protect timelines, budgets, and customer satisfaction.
For project managers handling complex projects, this approach is not “nice to have.” It is the difference between reacting late and taking corrective action when it still matters, across every phase of the project lifecycle. By why is it important in the first place?
Table of contents
- What Is Project Management Analytics?
- Benefits of Data Analytics in Project Management
- Key Metrics in Data Analytics for Project Management
- How to Implement Project Management Analytics in Professional Services
- Essential Data Analytics Tools & Programs
- What Is The Best Software for Project Management Analytics?
What Is Project Management Analytics?
Project management analytics is the use of data analytics for project management to collect, analyze, and interpret project data across the project life cycle, so project managers can make data-driven decisions that improve project performance, reduce risks, and deliver projects with better project outcomes.
In practice, it brings together data sources like time tracking, budgets, tasks, resource allocation, customer feedback, and delivery milestones. Then, using analytics tools (and sometimes machine learning or artificial intelligence), it helps teams identify trends, identify potential risks, and extract insights that support strategic decisions throughout the project lifecycle.
Benefits of Data Analytics in Project Management
Data analytics in project management gives teams structure and clarity in environments where uncertainty is common. By systematically collecting and analyzing project data, organizations can move from reactive reporting to a truly data driven approach that supports effective project management and long-term improvement.
The key benefits of applying data analytics for project managers and their teams include:
- Better visibility into project performance. With the right analytics tools, teams can track progress, budget consumption, and resource utilization in real time. This level of visibility helps stakeholders clearly see where the project stands and which areas require attention.
- Improved risk management. By examining historical datasets and current project data, teams can identify potential risks early. Predictive data analytics and project management practices, often enhanced by machine learning, make it easier to anticipate schedule delays, cost overruns, or scope creep before they escalate.
- More accurate budget control. Continuous analysis of costs, revenue, and burn rates enables project managers to track financial metrics closely. This makes it easier to identify deviations from the plan and take corrective action before the project budget is compromised.
- Optimized resource allocation. Data analytics for project management helps teams analyze workloads, availability, and productivity trends. As a result, organizations can allocate resources more effectively and avoid bottlenecks that slow down project progress.
- Stronger strategic decisions. When leaders rely on structured data analysis instead of intuition alone, they can identify opportunities for improvement across processes and operations. This supports long-term initiatives and ensures that project management aligns with broader business goals.
- Support for continuous improvement. Tracking trends across multiple data analytics projects allows organizations to compare business performance over time. These insights help teams refine their methods, enhance project success rates, and consistently deliver successful projects.
In short, project management analytics is a powerful tool that transforms raw data into actionable insights. It allows project managers and stakeholders to move beyond static reports and use data-driven decisions to shape the future of their projects.
Key Metrics in Data Analytics for Project Management
To make project management analytics actionable, teams must focus on metrics that clearly connect project data to performance, financial health, and delivery quality. The following metrics are widely used in data analytics for project management because they help project managers track progress, analyze trends, identify risks, and make data-driven decisions across the entire project lifecycle.
Schedule Variance (SV)
Schedule Variance shows whether a project is ahead of or behind its planned timeline by comparing earned value to planned value using the formula:
SV = EV − PV
A positive result indicates that work is progressing faster than expected, while a negative value signals delays. By consistently tracking SV, project managers can identify schedule risks early, adjust tasks or resources, and take corrective action before delays affect overall project outcomes and stakeholder expectations.
Cost Variance (CV)
Cost Variance measures the difference between the value of completed work and the actual cost incurred, calculated as:
CV = EV − AC
When the result is negative, the project is exceeding its budget; when positive, it is under budget. Monitoring this metric allows teams to analyze spending patterns, detect financial risks, and protect project success by making timely adjustments to budget allocations and delivery processes.
Cost Performance Index (CPI)
The Cost Performance Index evaluates cost efficiency by dividing earned value by actual cost, using the formula:
CPI = EV / AC
A CPI below 1 indicates cost inefficiency, while a value above 1 reflects strong financial performance. This metric helps stakeholders compare efficiency across initiatives, identify trends in overspending, and improve forecasting accuracy for future data analytics projects.
Resource Utilization Rate
Resource Utilization Rate reflects how effectively available resources are being used, commonly calculated as
(Billable Hours / Available Hours) × 100%
High utilization may indicate strong productivity, but if it remains too high for extended periods, it can signal burnout risks or declining quality. By analyzing utilization trends, organizations can allocate resources more strategically, balance workloads across the team, and support sustainable project performance.
Budget Burn Rate
Budget Burn Rate tracks how quickly a project consumes its allocated budget over a defined time period, often calculated as:
Budget Spent / Time Period
When spending accelerates faster than planned progress, it may point to scope creep or operational inefficiencies. Tracking burn rate alongside other financial metrics strengthens risk management and enables data-driven decisions that prevent late-stage budget crises.
Change Request Rate
Change Request Rate measures how frequently scope modifications occur during the project lifecycle, typically calculated as
Number of Change Requests / Time Period
A high rate of change often signals unclear requirements, shifting stakeholder expectations, or gaps in early planning processes. Monitoring this metric helps teams identify areas for improvement, stabilize delivery, and reduce risks tied to rework and budget overruns.
Customer Satisfaction Score (CSAT)
Customer Satisfaction Score reflects how satisfied clients are with the delivered work, usually calculated as
(Positive Responses / Total Responses) × 100%
This metric connects operational project performance with real customer feedback and perceived value. By tracking CSAT trends, project managers can identify improvement opportunities, strengthen customer satisfaction, and ensure that successful projects translate into long-term relationships and repeat business.
How to Implement Project Management Analytics in Professional Services?
Implementing project management analytics in professional services requires more than selecting the right tools. It involves aligning data analytics and project management processes, ensuring clean project data, and creating a data driven culture where project managers and stakeholders rely on measurable insights rather than assumptions. Below is a practical, step-by-step approach to embedding data analytics for project management into daily operations.
1. Define Clear Objectives and Success Criteria
Start by identifying what project success means for your organization. This may include improving project performance, increasing customer satisfaction, reducing cost overruns, or strengthening risk management. Clear objectives help determine which metrics to track and which aspects of the project lifecycle require the most visibility.
At this stage, project managers should collaborate with stakeholders to align on strategic decisions and define measurable targets. Without clearly defined goals, even the most advanced analytics tools will fail to deliver meaningful value.
2. Identify and Consolidate Relevant Data Sources
Effective project management analytics depends on accurate and comprehensive project data. Organizations must identify all relevant data sources, including time tracking systems, budgeting tools, task management platforms, CRM systems for customer feedback, and resource allocation records.
Bringing these datasets together into a centralized platform improves visibility and ensures that analysis reflects the full scope of project operations. Clean, standardized data enables more reliable data analysis and reduces the risk of misleading insights.
3. Choose the Right Data Analytics Tools and Programs
Selecting appropriate data analytics tools is critical for turning raw data into actionable insights. Professional services firms often rely on project management software with built-in analytics, specialized data analytics programs, and advanced analytics tools powered by machine learning or artificial intelligence.
The right tools should allow project managers to track key metrics, visualize trends through dashboards, and generate reports that support informed decisions. Ease of use is equally important, allowing project managers and even non-technical team members to extract insights without relying solely on a data scientist or human analysts.
4. Establish Standardized Reporting and Visualization
Consistent reporting processes ensure that everyone interprets project data the same way. Standard dashboards and visualization formats help stakeholders quickly identify trends, potential risks, and areas that require corrective action.
Strong visualization practices also make it easier to track project progress across multiple initiatives and phases. When project managers can clearly see how tasks, resources, budgets, and risks evolve over time, they gain better visibility and control over delivery.
5. Integrate Predictive Analytics and Machine Learning
Once foundational reporting is in place, organizations can expand into predictive analytics. By applying machine learning and artificial intelligence to historical data analytics projects, teams can forecast future performance, identify potential risks earlier, and optimize resource allocation.
For example, predictive models can analyze past trends to estimate whether a project is likely to exceed its budget or miss a deadline. This data driven approach strengthens risk management and supports proactive planning rather than reactive problem-solving.
6. Foster a Data Driven Culture
Even the most powerful tool will not improve project outcomes if teams ignore the insights it generates. Building a data driven culture means encouraging project managers to base decisions on analysis, track performance consistently, and view data as a strategic asset.
Leaders should reinforce the importance of using analytics in daily operations, reward evidence-based decision-making, and continuously refine processes based on measurable results. Over time, this approach leads to more successful projects, stronger stakeholder trust, and measurable improvement across the entire project lifecycle.
Essential Data Analytics Tools & Programs
To do project management analytics well, you do not just need “more reports.” You need a feature set that reliably turns project data into insights, supports data-driven decisions, and improves project outcomes across the full project lifecycle. Whether you are running delivery in professional services or managing internal initiatives, these are the essential capabilities to look for in data analytics tools and data analytics programs built for project management.
Centralized data capture across the project lifecycle
Strong analytics starts with complete, consistent project data. The platform should pull together time entries, tasks, project milestones, budgets, expenses, utilization, and customer feedback so project managers are not forced to stitch together multiple data sources manually. Centralization improves visibility and makes it easier to track project progress and compare performance across data analytics projects.
Real-time dashboards and KPI visualization
Effective project management analytics requires dashboards that update as work happens, not a static weekly export. Look for visualization that makes it easy to track key metrics like schedule variance, utilization, burn rate, and change trends. Clear dashboard views also help stakeholders quickly identify issues, spot trends, and focus on the aspects that need corrective action to keep deliver projects on track.
Flexible reporting and stakeholder-ready outputs
Professional services teams often need different views for different audiences: delivery teams, finance, executives, and clients. The best analytics tools let you filter by project, phase, team, role, and client, then generate consistent reporting without rebuilding everything from scratch. This supports informed decisions, reduces reporting overhead, and improves trust with stakeholders through transparent project performance updates.
Budgeting, forecasting, and profitability analytics
For many organizations, project success is inseparable from budget control. Essential features include planned vs actual budget tracking, burn rate monitoring, margin and profitability views, and forecasting based on current delivery signals. This kind of data analysis helps project managers manage financial risks early, improve resource allocation, and drive better project outcomes with fewer surprises late in the project life cycle.
Resource allocation and capacity planning analytics
Analytics should help you allocate resources intelligently, not just show utilization after the fact. Look for capacity planning that highlights overload risk, underutilization, and skill gaps across upcoming work. When project managers can model scenarios (what happens if priorities shift, or a key person is unavailable), they gain better visibility and can reduce delivery risks in complex projects.
Risk management signals and early warning indicators
A platform that supports risk management should make it easy to identify potential risks before they derail project outcomes. That can include alerts for schedule slippage, accelerating spend, rising change request rates, or repeated blockers across tasks. These early warning signals turn project management analytics into a powerful tool for prevention, not post-mortems.
Predictive analytics using machine learning
Modern data analytics in project management increasingly includes machine learning to predict schedule delays, budget overruns, and resourcing bottlenecks based on historical patterns. This is especially useful when teams run multiple initiatives and need a data driven approach to prioritize attention. Predictive models do not replace project managers, but they can surface risks and opportunities sooner than manual inspection by human analysts.
Automation, data quality controls, and governance
Analytics is only as good as the inputs. Essential features include automated data collection (to reduce manual entry errors), validation rules, audit trails, and permissions that protect sensitive financial and customer data. Good governance keeps datasets reliable and ensures data insights are trusted enough to guide strategic decisions.
Integrations and a clean analytics layer
Even the best project management software rarely lives alone. Essential analytics features include integrations with finance, CRM, HR, and BI systems, plus APIs or connectors that keep data flowing. The key is minimizing manual exports and ensuring consistent definitions for metrics, so teams can analyze performance with confidence.
Self-service analytics for project managers
Project managers should be able to extract insights without needing a data scientist for every question. Look for intuitive exploration (filters, drill-downs, saved views) that lets teams answer practical questions like “which phase is driving cost variance?” or “where is project progress slowing?” Self-service capability makes data analytics for project managers part of daily operations, not a separate analytics project.
What Is The Best Software for Project Management Analytics?
The best software for project management analytics is BigTime.
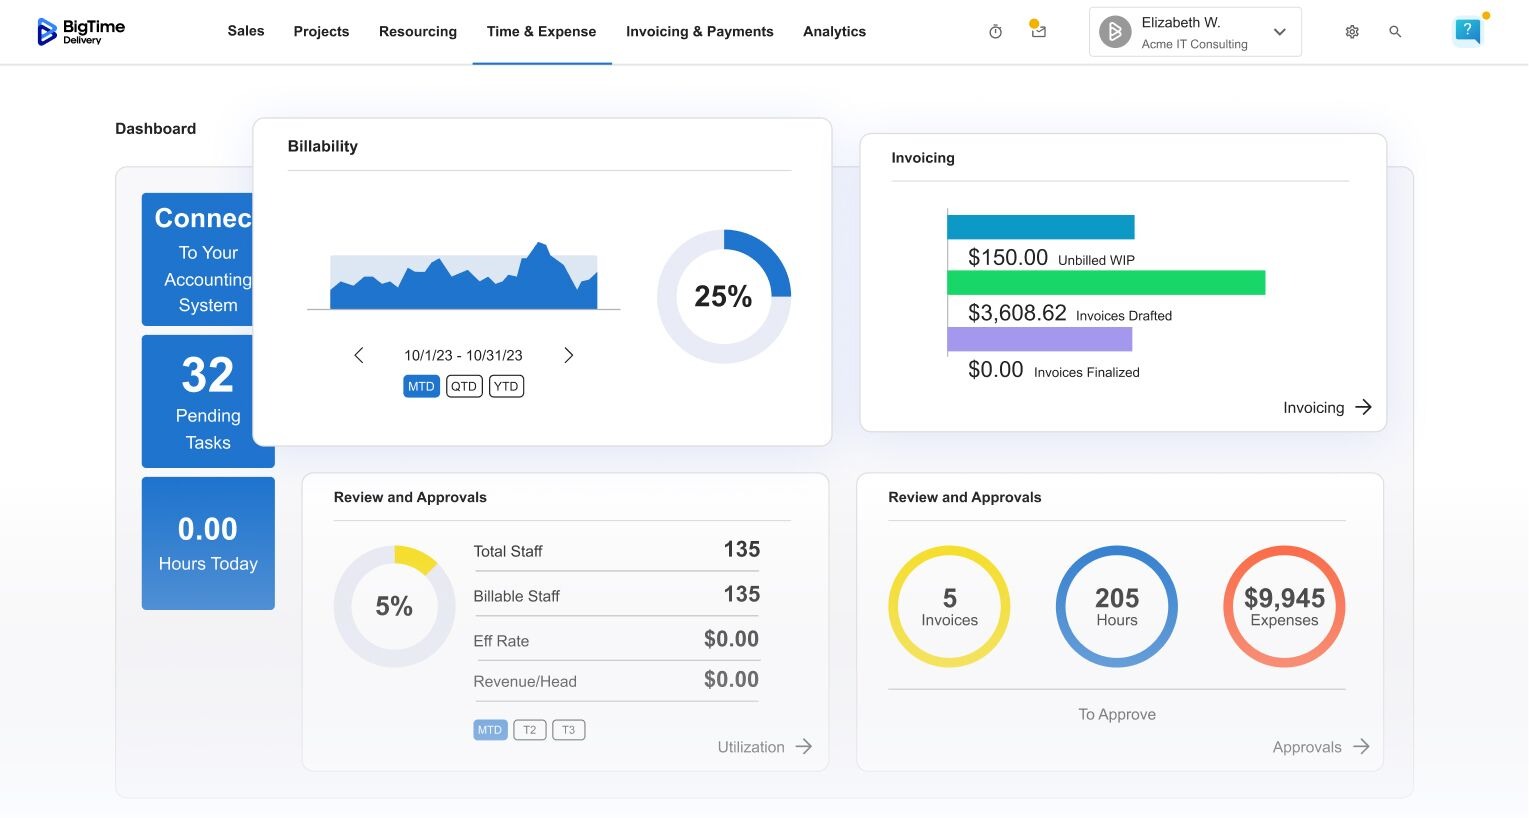
BigTime stands out because it was built specifically for professional services organizations that need deep, practical project management analytics embedded directly into daily operations. Instead of treating analytics as a separate reporting layer, BigTime integrates time tracking, budgeting, resource allocation, billing, and forecasting into one unified project management software environment. This creates a single source of truth for project data, improving visibility and enabling truly data-driven decisions.
One of BigTime’s greatest strengths is how it connects financial and operational data analytics in project management. Project managers can track key metrics such as cost variance, utilization, burn rate, and revenue forecasts in real time. This allows teams to identify risks early, take corrective action before issues escalate, and protect both project performance and customer satisfaction. By embedding analytics directly into project workflows, BigTime ensures that insights are not theoretical but actionable.
In short, BigTime combines powerful analytics tools, centralized project data, financial tracking, and predictive intelligence into a single, scalable platform. For organizations seeking effective project management, stronger project success rates, and consistently better project outcomes, BigTime delivers the most complete and practical solution.