
The Enterprise BI Agent is now active inside BigTime Enterprise PSA. Getting answers out of your data used to mean filing a report request and waiting, but now you can just ask your questions directly. If you are looking for a straightforward way to get clear visibility, the agent is ready to help.
You can use everyday words to interact with your records, build custom views, and generate text summaries on demand. This practical guide helps your team get started immediately, covering prompt strategies you can copy and use alongside your five pre-built Premium Dashboards.

How to Write a Prompt the Agent Understands
Interacting with AI does not require technical coding experience. To get the most accurate insights from the Enterprise BI Agent, you can apply a few basic prompt guidelines:
- Name the metric and the slice. Explicitly state the exact measurement, project name, or region you need to evaluate rather than asking a general question.
- Ask for the business takeaway. Instruct the agent to rank results by financial impact or flag items below a certain line so your next operational step is clear.
- Start with a question first. Ask a direct question about your figures before telling the agent to build a multi-chart dashboard page.
- Request summaries for quick reporting. Ask the agent to draft a text overview when you need to drop a quick briefing into an executive email.
Three Ways to Work With It: Ask, Build, Summarize
The agent adapts to your immediate workload by operating in three distinct functional modes.
1. Ask a Question
When you need a rapid trend check during a meeting, you can type a direct question. This lets you pull numbers without changing your layout, providing instant answers to ad-hoc questions.
| “How much revenue are we leaving on the table due to discounting vs. write-downs, and which projects are the worst offenders?” |
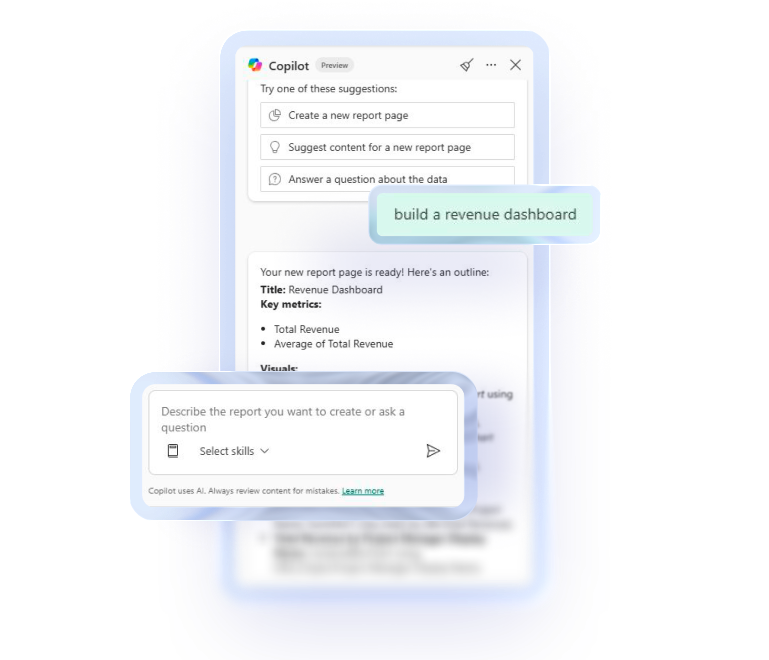
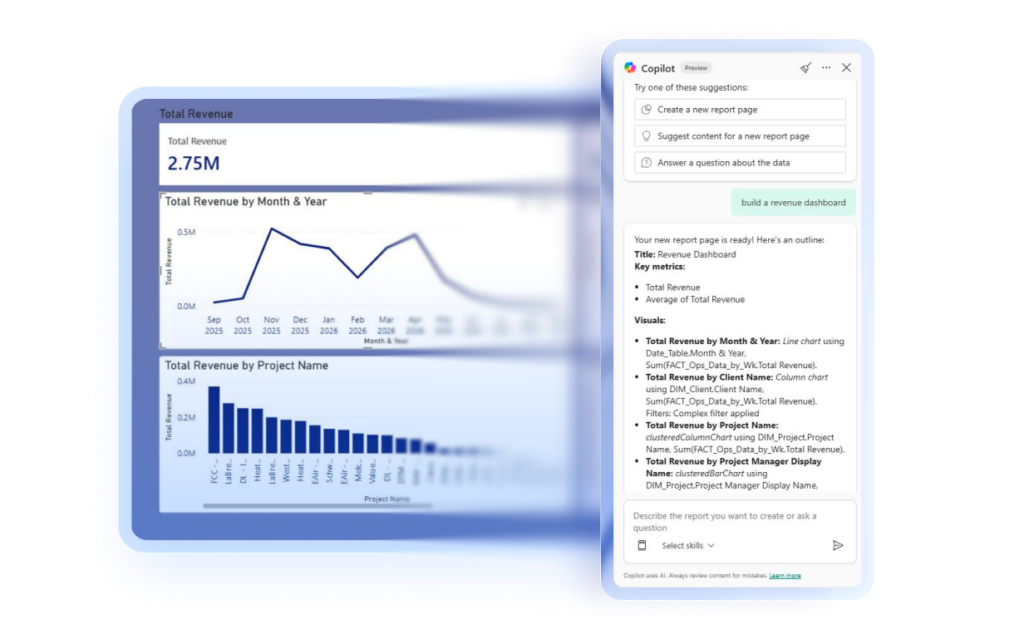
2. Build a Dashboard
When you need a new visual report to track a specific metric, describe the charts in plain English. The agent handles the chart creation, taking you from idea to published dashboard up to 20X faster.
| “Create a margin waterfall page – show margin target, actual margin, and the three loss layers (discounting, write-downs, contract terms) stacked for each project.” |
3. Generate a Written Summary
The agent can also explain what your data means in words right next to your charts. This narrative text updates automatically as you change your filters, giving your team a quick operational brief.
| “Write a 3-sentence executive briefing on resource readiness. Lead with the largest single coverage gap by FTEs, state the total revenue at risk across all open roles, and close with a recommendation on whether the pipeline should be paused, hiring accelerated, or reallocation considered.” “Analyze the three margin loss layers across the current project portfolio. Identify which loss type – discounting, write-downs, or contract terms – is the largest drag on margin, which specific projects are driving it, and whether the losses are structural (discounting set at contract) or behavioral (write-downs applied post-contract).” “For any project currently below the 50% margin target, explain the primary reason margin is short – is it rate erosion from discounting, post-contract write-downs, or NTE cap absorption? Rank the projects by total dollar margin gap and suggest which type of intervention would recover the most margin.” |
The Five Premium Dashboards, and Prompts to Start With
The Enterprise BI Agent ships alongside a ready-to-use package of five Premium Dashboards. These pre-built views provide a stable reporting foundation, allowing your team to use the unique prompts below to explore your own data.
1. Resource Demand & Supply
This dashboard lets you see where you are about to be short-staffed or overcommitted, while there is still time to hire, move people, or reshape the pipeline. It connects your forward-looking opportunity pipeline directly to your headcount capacity.
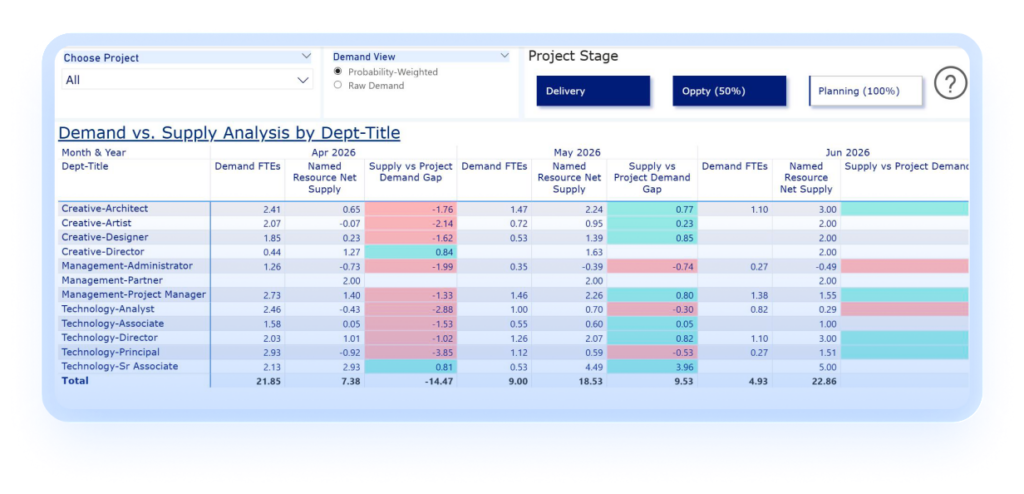
To build a tailored view of your upcoming talent pipeline, use this prompt:
| “Build me a Resource Supply & Demand dashboard showing FTE coverage gaps by Dept-Title, with a toggle between raw demand and probability-weighted demand.” |
2. Resource Utilization
This view helps managers spot who is under-booked and who is overloaded, so you protect both margin and your people. It tracks your active billable efficiency across specific roles and departments in a single view.
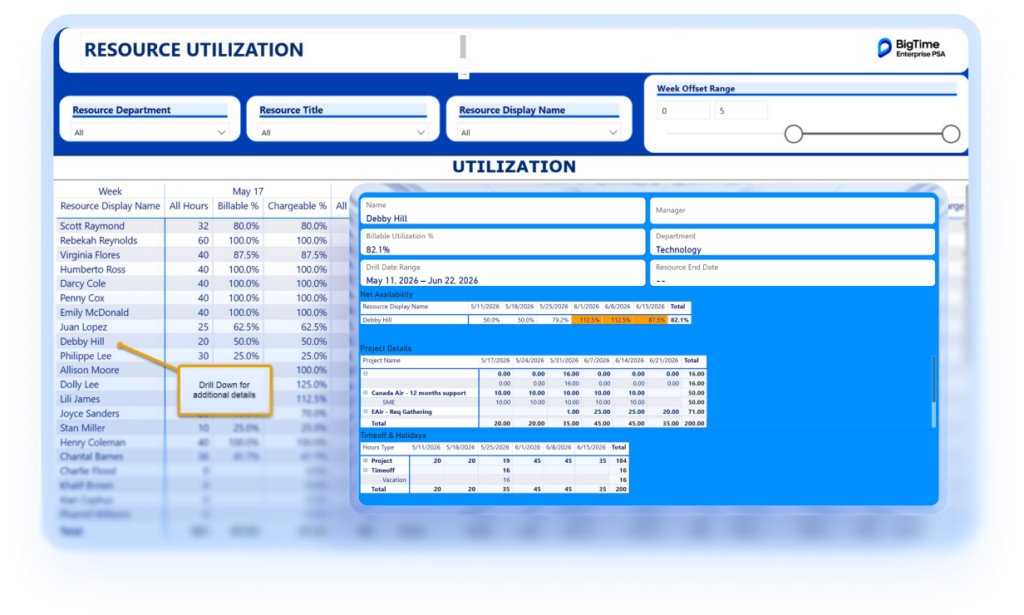
To view your individual performance lines, copy and paste this text:
| “What’s our current billable utilization vs. target, and which resources are below the minimum threshold?” |
3. Project Plan vs Actual
This layout ensures you can catch an overrun while the project is still running and you can act on it, not at month-end when it is already a write-off. It directly exposes variance by comparing your scheduled resource allocations against actual logged hours.
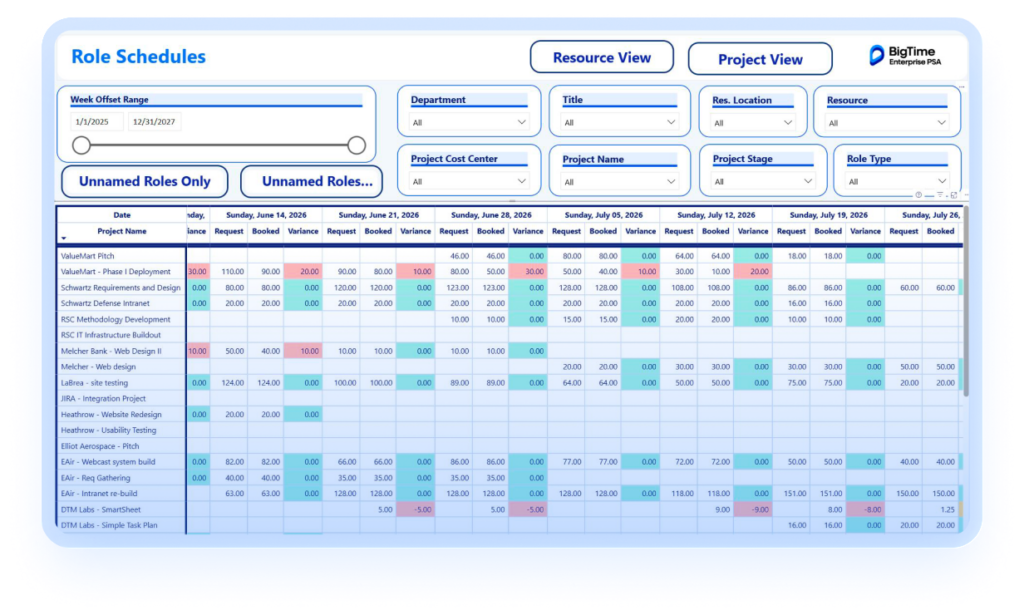
To check for current project overruns, copy and paste this text:
| “List all active projects where actual submitted hours have exceeded planned hours, ranked by the size of the total overrun.” |
4. Delivery Readiness
This pre-built view allows you to confirm every requested role on every project is actually staffed, so delivery does not stall after the deal is signed. It ensures your project managers spot unassigned pipeline allocations before active client delivery begins.
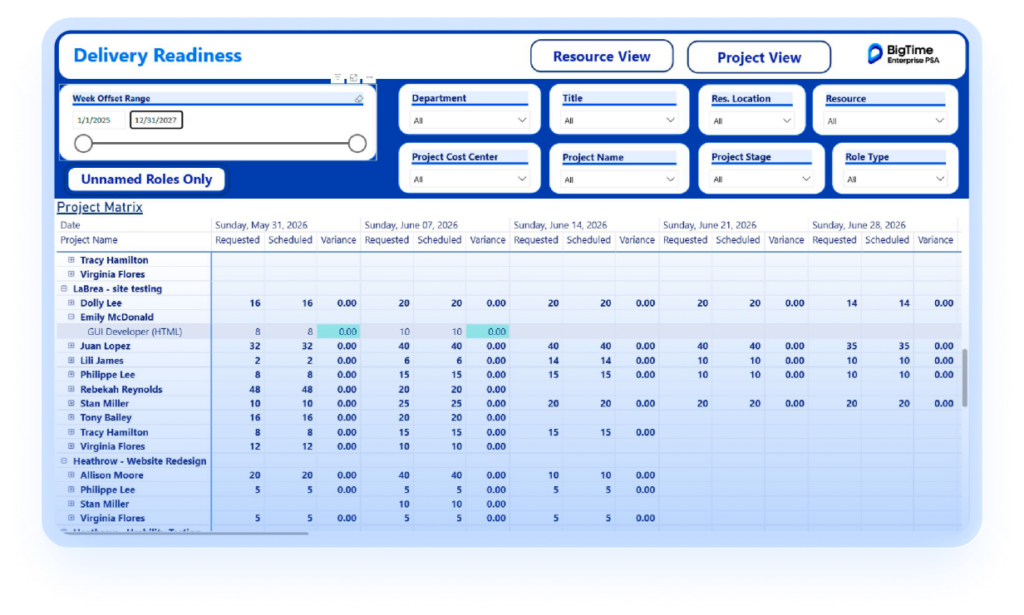
To uncover unassigned roles instantly, use this prompt:
| “Show all unstaffed requested roles across our active project portfolio, rank the projects by proximity to the start date, and display the total count of unassigned positions.” |
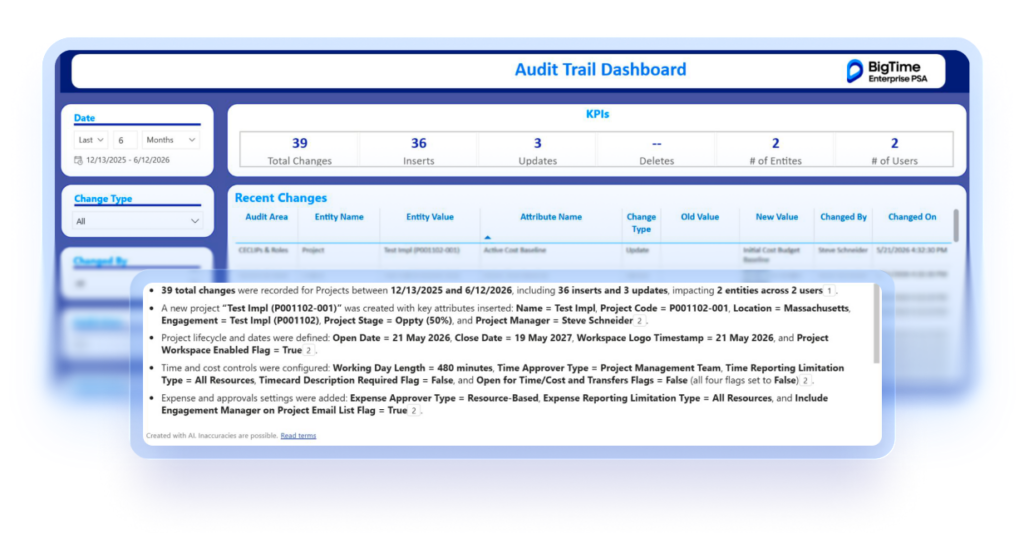
5. Audit Trail
This layout helps you know exactly what changed, when, and who changed it, so governance and audit questions answer themselves. It automatically captures and visualizes system metadata and critical configuration updates.
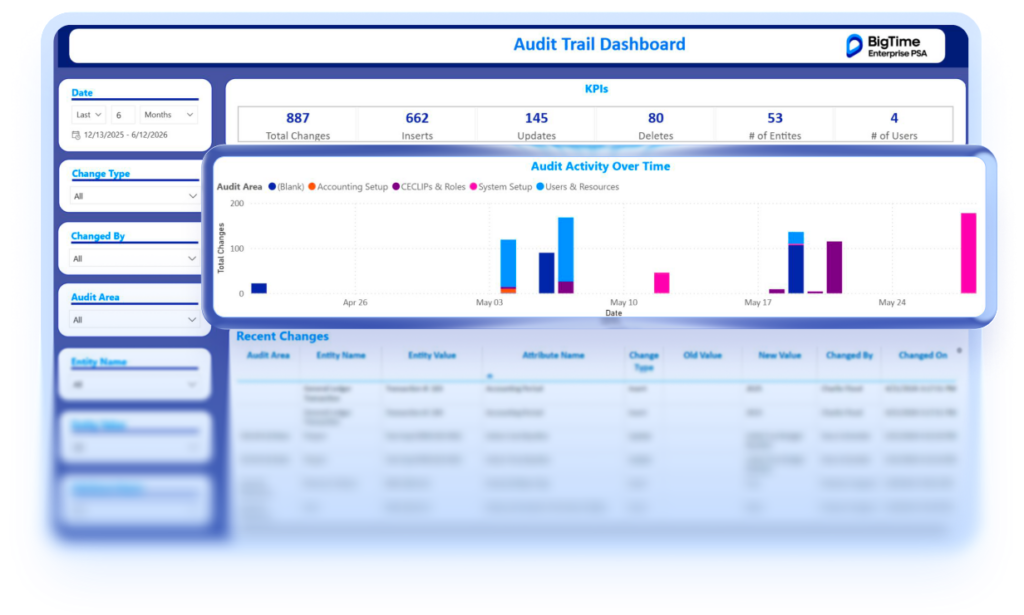
To verify operational data modifications within your governance workflow, copy and paste this prompt:
| “Identify all operational changes made to project cost baselines over the last 14 days, listing what changed, when the modification occurred, and who made the update.” |
Go Further: Ask Across Your Whole Business
Connecting separate data domains usually takes hours of manual work. The Enterprise BI Agent removes this step because it runs natively across your entire Enterprise PSA data model. Because your project, financial, and resource records reside in a unified architecture, the agent can execute multi-domain queries within a single prompt thread.
Try running these multi-domain prompts within your Power BI workspace:
| “Which projects are over budget on hours AND below the margin target – rank them by revenue at risk.” “What’s our revenue run rate if we fill all open staffing gaps, assuming current revenue-per-employee holds?” |
Shaping the Role of the Analytics Architect
This conversational approach gives your business intelligence experts their time back to focus on high-value data design, forecasting, and strategic analysis. The analyst shifts into the role of an analytics architect, owning the master data model and governance rules while the rest of your firm self-serves day-to-day answers. The routine requests that used to fill their queue are the ones that now require zero analyst hours, freeing them for the work only they can do.
How You’ll Get Started
- Application integration. The five Premium Dashboards are embedded directly inside BigTime Enterprise PSA under your existing user configurations and permission roles.
- Workspace hosting. The Enterprise BI Agent runs inside a dedicated Power BI workspace that BigTime hosts and manages, requiring a Power BI Pro license for active users but leaving nothing for your technology team to maintain.
- Data security. Customer data is not used to train shared or public AI models, AI processing runs through Microsoft Azure OpenAI Service, and existing EPSA permissions carry through.