In today’s fast-paced business world, leaders need more than raw data; they need actionable insights delivered in real time. That’s where the executive dashboard comes in.
Acting as a centralized hub for critical metrics and reports, executive dashboards provide decision-makers with a clear, high-level view of organizational performance. Whether you’re tracking financial health, project progress, or resource allocation, an executive dashboard transforms scattered information into a visual story that supports faster, more informed decisions.
In this guide, we’ll walk through the essentials of executive dashboards, explore different types and use cases, and provide executive dashboard examples to illustrate their value in practice. We’ll also share a step-by-step process to build your own dashboard, along with tools that make creating executive project dashboards not only easier but also far more reliable than manual methods.
What are executive dashboards?
An executive dashboard is a data visualization tool designed to give leaders, chief executive officers and decision-makers a high-level overview of business performance. Unlike spreadsheets or static reports, executive dashboards consolidate data from multiple sources into a single, interactive interface. The result is a real-time summary of key performance indicators (KPIs) and trends that matter most to executives.
The main purpose of an executive dashboard is to simplify complex data and present it in a way that supports fast, informed decision-making. For example, instead of combing through dozens of reports, executives can quickly see company’s financial health, project health, customer satisfaction, or utilization rates all in one place. This not only saves time but also ensures that leaders can act on insights without delays.
Modern dashboards go beyond simple reporting by highlighting correlations, trends, and risks. They help answer critical questions such as:
- Are projects aligned with strategic business goals?
- Which departments are over budget or underperforming?
- How is overall productivity evolving compared to last quarter?
By providing answers to these questions, executive dashboards become more than just reporting tool; they serve as a strategic compass guiding decision-making across the organization.
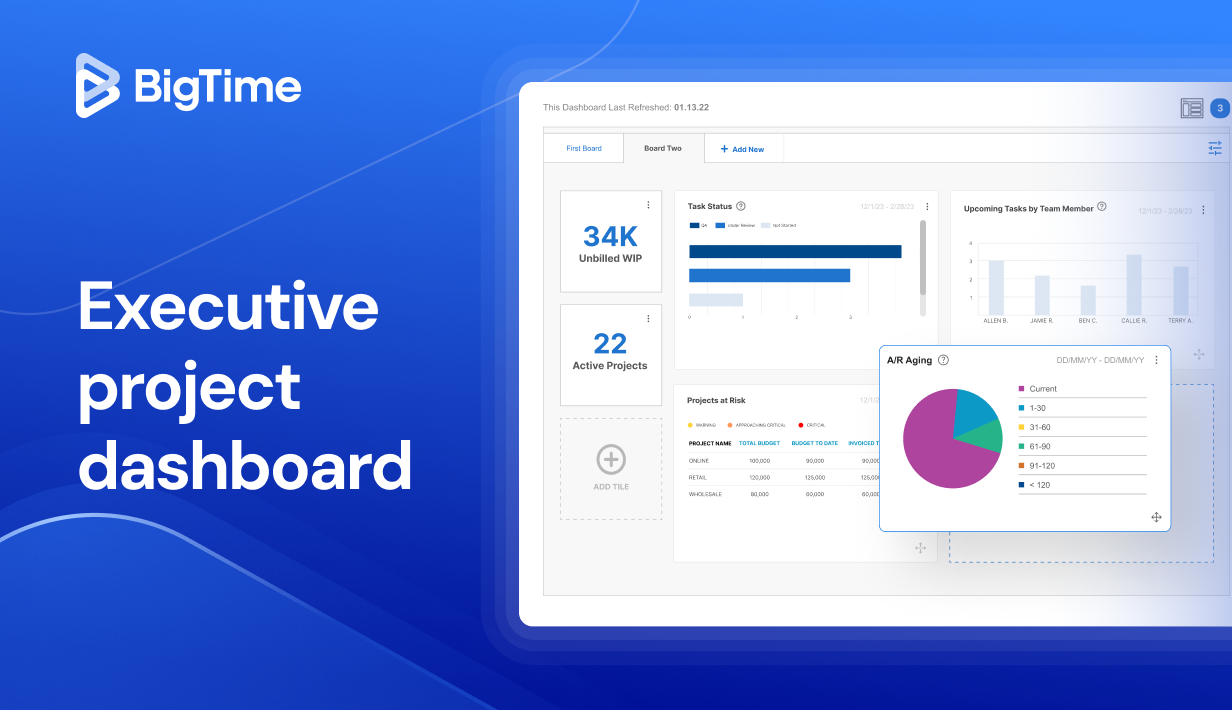
What are executive project dashboards?
An executive project dashboard is a specialized type of executive dashboard designed specifically to track, monitor, and report on project performance. While a general executive dashboard may cover company-wide metrics, an executive project dashboard focuses on project-specific indicators such as project timelines, budgets, resource allocation, and project milestones.
The goal of an executive project dashboard is to give leaders a real-time overview of project health, ensuring that initiatives stay aligned with business strategy. By consolidating project management KPIs into one interface, executives and project managers can quickly identify risks, prevent bottlenecks, and keep teams accountable based on actual business data.
The benefits of an executive dashboard
Implementing an executive dashboard brings clear advantages for organizations, especially those managing multiple projects at once. The benefits of using such data sources include:
- Centralized insights – All critical data is displayed in one place, giving leaders a clear overview without the need to dig through separate reports or systems. Additionally, with a single source of truth on all the important metrics, the entire executive team is always on the same page – no clarifications needed.
- Faster decision-making – With real-time updates and visualized KPIs, executives can identify risks and opportunities immediately, making proactive adjustments instead of waiting for data from various sources.
- Improved accountability – Dashboards connect performance metrics with responsible teams, creating greater ownership of results and allowing them to actively shape key metrics in their projects.
- Enhanced project tracking – Especially with an executive project dashboard, leaders can monitor milestones, project budgets, and resource use to ensure projects stay on track – all while making project tracking simpler and faster.
- Data-driven storytelling – Executive dashboards turn raw data into clear, visual reports that are easy to share with stakeholders, improving communication and transparency.
- Strategic alignment – By focusing on high-level KPIs, dashboards ensure that operational efforts directly support long-term business goals.
For project-driven companies, the benefits are even more significant. An executive project dashboard provides not just oversight but also the ability to forecast outcomes, identify bottlenecks, and allocate resources more effectively. This means less time spent chasing data and more time driving results with more strategic planning.
Types of executive dashboards
While every executive dashboard, whether it’s a marketing dashboard, management dashboard or financial dashboard, is designed to provide clarity and insight, the type of dashboard you choose depends on the goals, audience, and data requirements of your organization. Broadly, there are four main types: strategic, analytical, operational, and tactical, and each has its own role in decision-making.
| Type of Dashboard | Purpose | Best For |
| Strategic Dashboard | Tracks long-term business goals and overall performance | Executives & leadership teams |
| Analytical Dashboard | Examines detailed data, trends, and comparisons for decision support | Analysts & data-driven managers |
| Operational Dashboard | Monitors daily activities and real-time performance metrics | Operations managers & supervisors |
| Tactical Dashboard | Focuses on short-term goals and team-level performance | Middle managers & project leaders |
Strategic dashboard
A strategic dashboard is designed to provide executives and senior leaders with a high-level view of the organization’s long-term goals, allowing them to track performance in the company as a whole. It focuses on metrics that measure progress against the company’s strategic objectives, such as revenue growth, market share, or customer retention.
By consolidating these KPIs into one view, strategic dashboards help leaders evaluate whether the business is moving in the right direction and make course corrections if needed. These dashboards are typically updated less frequently, monthly or quarterly, since they deal with long-term trends rather than daily operations.
Analytical dashboard
An analytical dashboard digs deeper into the data, helping managers analyze data, identify patterns, and keep an eye on all the insights across large datasets. Unlike strategic dashboards, which provide a top-level overview, analytical dashboards allow users to interact with the data, drill down into specifics, and run comparisons.
These dashboards are especially useful for performance reviews, resource and financial forecasting, and uncovering the root causes of problems. For example, an executive team may use an analytical dashboard to understand why sales are declining in a specific region or why project delivery timelines are slipping.
Operational dashboard
An operational dashboard focuses on real-time activities and short-term performance. It gives managers and supervisors a live view of key processes, ensuring that day-to-day operations are running smoothly and allowing them to make data-driven decisions based on live data.
These dashboards often refresh automatically throughout the day, providing immediate visibility into bottlenecks or issues that need to be addressed quickly. They are especially valuable in environments where speed and efficiency are critical, and any issues need to be resolved quickly, before they affect company’s financial health.
Tactical dashboard
A tactical dashboard sits between operational and strategic dashboards. It focuses on medium-term goals and team-level performance, often helping department managers and project leaders translate strategic objectives into actionable steps without processing massive amounts of data.
For example, a tactical dashboard might show whether a project team is meeting its weekly milestones, staying within budget, or maintaining employee productivity. These dashboards give mid-level managers the tools they need to guide their teams effectively while keeping their work aligned with broader business strategies and company goals.
5 steps to create an executive dashboard
Building an effective executive dashboard requires more than just collecting data—it’s about designing a tool that delivers clarity, context, and real business value with real-time insights and conclusions drawn from important data. To achieve this, you need a structured approach that ensures the right information reaches the right audience at the right time.
Here are five steps to guide you through the process:
Identify your audience
Every dashboard should start with a clear definition of who will use it. An executive looking for high-level strategic insights will not need the same level of detail as a project manager monitoring tasks day to day. If you don’t tailor your dashboard to its audience, you risk overwhelming users with irrelevant data or, worse, leaving them without the information they need. For example:
- Executives need the big picture: KPIs like profitability, client satisfaction, and project portfolio performance.
- Project managers need visibility into milestones, task completion, and resource availability.
- Analysts may require deeper drill-downs into costs, risks, and performance trends to find room for improvement.
Defining your audience ensures that your executive dashboard is not only informative but also actionable.
Define KPIs and metrics
The heart of any executive dashboard lies in the KPIs and metrics it tracks to monitor various aspects of your business. But not all data deserves a spot – especially when taking into account the needs of particular target audiences.
A common mistake is cramming too much information into a dashboard, which creates clutter and confusion. Instead, focus on the critical indicators that directly reflect your business goals and the type of your executive dashboard:
- A strategic dashboard should highlight metrics tied to long-term growth, such as revenue expansion, customer retention, or market penetration.
- An executive project dashboard should emphasize project-specific KPIs and real-time data like budget variance, milestone achievement, and resource utilization.
- An analytical dashboard might include more detailed metrics to identify trends or investigate bottlenecks.
When you choose KPIs carefully, your dashboard becomes a decision-making tool rather than a data dump.
Design your dashboard
Design is often underestimated, yet it determines how quickly users can interpret the information presented. A poorly designed dashboard overwhelms users with numbers, while a well-designed one highlights key insights instantly.
To ensure that your executive dashboard is truly a powerful tool, start by prioritizing the most important KPIs at the top and ensure your layout is easy to scan. Use visual hierarchy such as larger graphs for critical metrics and smaller widgets for supporting data, and incorporate interactive features like filters or drill-downs so executives can switch between a high-level overview and detailed views without clutter.
Still, the work on the visuals does not end here. To ensure that your data is easy to interoret, apply consistent color coding to quickly signal performance: green for on target, yellow for at risk, red for critical. Such a good design helps your executive dashboard do more than display information—it helps tell the story behind the numbers.
Deliver value and tell the story
Data on its own has little impact unless it’s framed in a meaningful way. That’s why every executive dashboard should tell a story. This means showing not just where the organization is today but how it got there and where it’s headed.
To ensure that managers can draw valuable conclusions from your data, use historical comparisons to highlight whether performance is improving or declining over time. Add contextual notes or annotations to explain sudden changes, such as a budget spike caused by new hires or a temporary drop in productivity due to system outages. Additionally, align metrics with strategic objectives, so every number has a clear purpose and relevance.
Use specialized tools
While it’s possible to create dashboards manually in Excel or PowerPoint, these methods come with significant drawbacks: they’re time-consuming, error-prone, and lack real-time updates. As projects grow more complex, these limitations become even more apparent. This is where specialized tools come in.
Platforms like BigTime are designed specifically to handle executive dashboards and create them in seconds without a single error. With BigTime’s key features and easy to use interface, you can:
- Pull live resource, project and financial data directly from project and financial systems, eliminating manual entry.
- Visualize KPIs in customizable, real-time dashboards and charts tailored to executives and project managers alike, and create report templates you can reuse in the future.
- Get a clear view of employees, projects and finances and drive proactive changes in your processes.
- Automate recurring reports, saving countless hours and ensuring accuracy.
- Seamlessly track budgets, resources, and milestones across multiple projects.
By relying on a dedicated solution, your executive dashboard evolves from a static report into a dynamic strategic tool that keeps leadership aligned and projects on track.
Ready to experience the difference? Book a free demo with BigTime today and see how you can transform raw data into actionable insights that drive smarter decisions.
FAQ
What is the concept of the dashboard?
A dashboard is a visual reporting tool that consolidates key information into a single view. It helps users track metrics, identify trends, and monitor performance in real time. Unlike static reports, dashboards update dynamically and provide interactive insights for faster decision-making.
What is an executive dashboard?
An executive dashboard is a specialized reporting tool that gives leaders a high-level overview of organizational performance. It consolidates critical KPIs, such as revenue, resource utilization, and project progress, into one centralized, visual interface. The goal is to support strategic decision-making with accurate, real-time insights.
How to build an executive dashboard?
You can build an executive dashboard by first identifying your audience, selecting the right KPIs, and then designing a layout that communicates insights clearly. Basic dashboards can be created using Excel or presentation tools, but these methods are slow and error-prone. For accurate, automated, and real-time results, specialized tools like BigTime are far more effective.
How to build an executive dashboard in Excel?
To build an executive dashboard in Excel:
- Collect and organize data into tables.
- Use PivotTables to structure and summarize metrics.
- Insert charts and graphs to visualize KPIs.
- Arrange visuals into a dashboard layout.
While Excel works for simple dashboards, it lacks automation, real-time updates, and scalability. For professional dashboards that executives can rely on, tools like BigTime offer a far more precise and efficient solution.
What is the fastest way to create project dashboards?
The fastest way to create project dashboards is by using specialized project management software. Tools like BigTime automate data collection, reporting, and visualization, which means executives don’t have to spend hours updating spreadsheets. This ensures dashboards remain accurate, consistent, and instantly available.
What is the best tool for creating an executive dashboard?
The best tool for creating an executive dashboard is BigTime. Unlike spreadsheets or generic reporting tools, BigTime integrates project, resource, and financial data in real time. It automates reporting, ensures accuracy, and delivers customizable dashboards tailored to executives’ needs.
Book your free BigTime demo and see how easy it is to transform complex data into actionable insights.