This calculator is designed for mid-sized professional services firms with a fairly standard implementation and operating model. Results are most representative when your delivery, billing, and reporting processes follow common industry patterns – so the expected PSA impact (productivity, utilization, and margin improvement) is comparable across similar firms.
What’s driving your ROI?
Months needed to recoup costs using ramped monthly benefits. Understand the productivity and margin projections behind your total return.
2,137
Admin hours saved / year
Your estimated annual reduction in hours spent reconciling spreadsheets and fragmented tools. This number includes hours saved from simplifying time tracking – cutting down on manual corrections and freeing your billable and non-billable for higher-value work.
2,137
Billable hours saved / year
Hours recovered by reducing non-billable admin/reporting time. SPI benchmarks support this direction: organizations using PSA report higher utilization (70.2% vs 65%), meaning they have more billable time captured compared to other organization with the same theoretical capacity.
36.6%
New project margin (%)
Improved visibility and control over delivery economics translate into real and consistent financial gains. SPI benchmarks show PSA users report project margins (36.9% vs 33.3%), supporting margin uplift as a realistic outcome when processes are standardized and data is consistent.
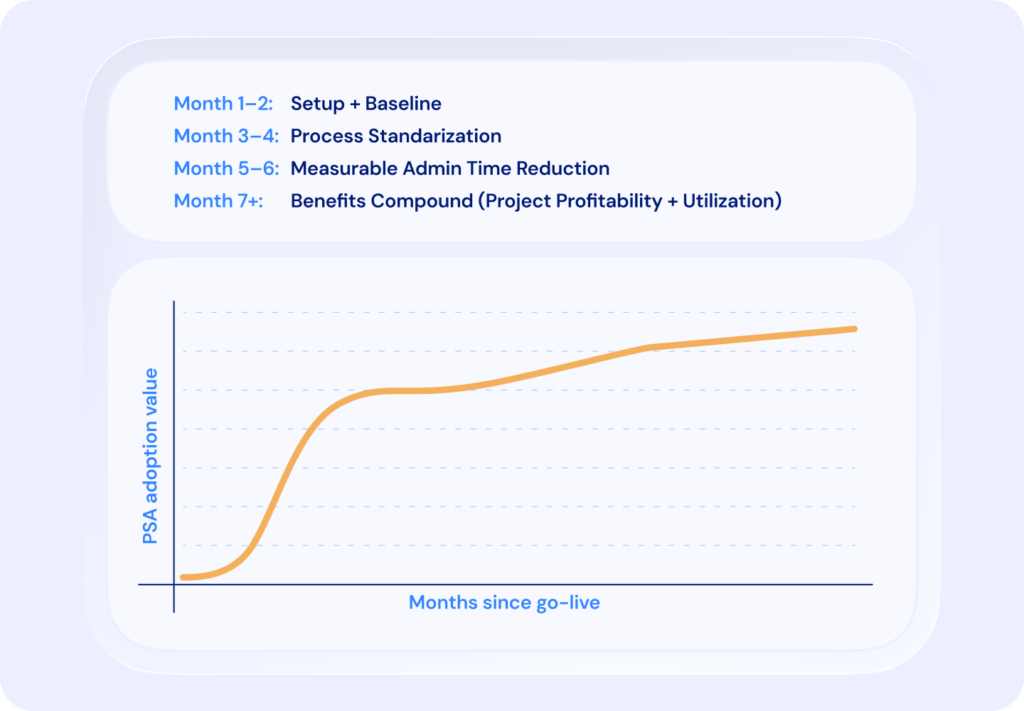
Time to Value: Adoption Curve
Time to value depends on implementation-friendly software, quality onboarding support, and existing processes. Organizations with less mature operations will see the biggest upside from replacing manual work and disconnected tools. As adoptions grows, value ramps, resulting in ROI that increases over time.
See how BigTime drives PSA adoption value
Lose the disconnected tools and manual workflows. With a support-led implementation path, maximize your billable hours and achieve measurable ROI within the first year.
CONSULTING
How Aegis Accelerates Cash Flow With BigTime
“We get time card data onto an invoice, reviewed by managers, and out the door to a client in 50% less time than we did previously. We’re getting paid much faster than we were previously and our days sales outstanding dropped nearly six days entirely across the company due to these efficiencies being added.”
50%
Decrease In invoicing time
6 day
Decrease In DSO
Kyle MacDonald
CFO
CONSULTING
How Priority Designs Recovered $50K in Annual Revenue with BigTime Delivery
“I was spending so much time in the weeds trying to make sure that each project ran successfully, but I didn’t have time to actually do CFO things. PMs didn’t feel like they had the ability to be good project managers because they weren’t comfortable with the information they were getting”.
2X
Growth
In 2 years
100%
Integrated
Project management
Todd Henson
CFO
IT Services
How Billennium Rolled Out BigTime to 1500 Employees in Just 3 Months
“I don’t have to anxiously await the end of the billing period. Our forecasts barely differed from reality, giving me peace of mind in my work.”
+14%
Rise
in resource Utilization
99%
Accuracy
in forecasts and plans
Piotr Kawęcki
Co-Founder and CFO
Ready to unlock your PSA benefits?
Review your ROI results with a PSA expert and get a clear path to faster adoption, higher utilization, and healthier project margins.